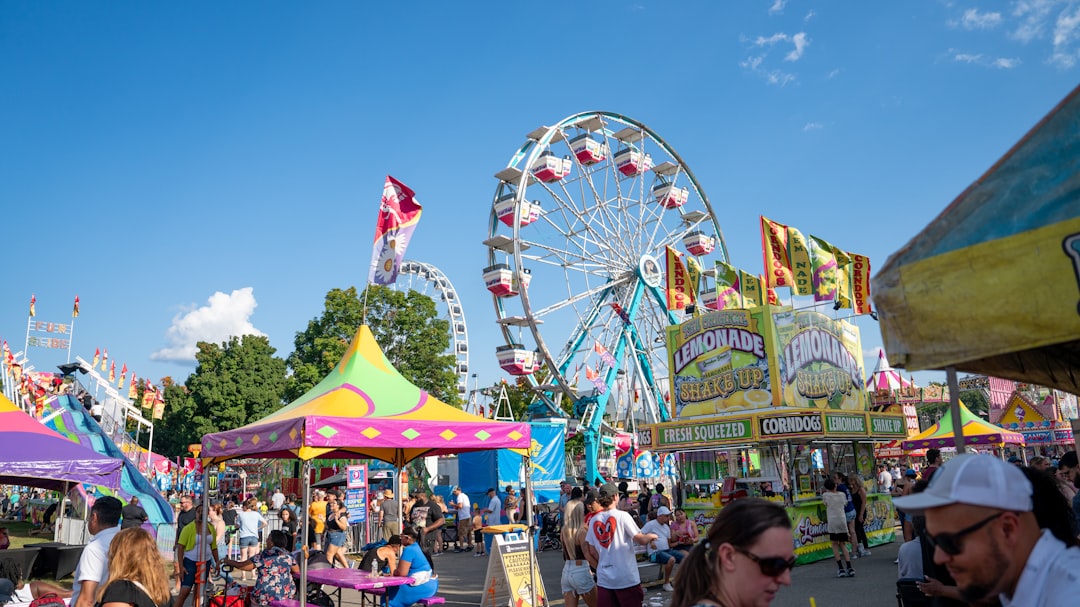
Choosing the right trade fair is the single highest-leverage decision in any annual exhibition programme. Get it right and a EUR 180,000 participation generates EUR 6 to 12 million in qualified pipeline. Get it wrong and the same spend produces a stack of business cards, a hangover, and a marketing director’s quarterly review you would rather not relive.
This article walks through the weighted scorecard methodology experienced European exhibition managers use to prune a long-list of forty plausible fairs down to the three-to-seven fairs that genuinely justify budget.
The framework is built on AUMA’s exhibitor cost benchmarks, UFI’s Global Exhibition Barometer, CEIR’s annual research on B2B exhibition performance, and observed practice at the mid-market and enterprise exhibitors that staff Hannover Messe, Anuga, Bauma, EuroShop, IFA, ISE, drupa, K, and the regional vertical fairs that anchor most European B2B calendars.
Why the scorecard exists
Most exhibitors choose fairs through a hybrid of habit, conference room intuition, and whatever the previous marketing director did. The honest reason that habit dominates is that the decision is hard. The right fair depends on a combination of audience profile, competitive density, organiser quality, calendar fit, and budget envelope, and no single fair tops every dimension. A scorecard surfaces the tradeoffs explicitly rather than letting them get buried in opinion.
“The exhibitors who win on cost-per-qualified-lead are the ones who treat fair selection as a portfolio management problem rather than a calendar question. They model expected return per fair, hold a reserve for tier-three exploration, and rebalance every twelve to eighteen months.”, UFI Global Exhibition Barometer, summary commentary on exhibitor-side performance, 2025 edition
The scorecard below is deliberately structured to be filled in two hours by a small team rather than three months by a research firm. Precision is less important than consistency: scoring twelve candidate fairs on the same eight criteria forces tradeoffs into the open.
The eight scoring criteria
The eight criteria below cover the dimensions that AUMA, UFI, CEIR and EMECA agree on as the determinants of exhibitor outcomes. Each is scored 0 to 10, weighted, and summed. Weights reflect what experienced managers actually trade off rather than a theoretical purity.
| Criterion | Weight | What you are scoring | Where the data comes from |
|---|---|---|---|
| Audience quality (declared decision-makers) | 20% | Share of attendees with budget authority for your category | UFI-audited visitor reports, organiser declarations |
| International audience share | 12% | Share of attendees from outside the host country | UFI audit, exhibitor surveys |
| Buyer density per square metre | 15% | Qualified buyers per sqm of exhibition floor | Visitor numbers / net exhibition area |
| Category authority of the fair | 12% | Is this the fair the industry talks about? | Industry press coverage, exhibitor word-of-mouth, peer surveys |
| Exhibitor satisfaction (prior edition) | 10% | Net Promoter Score or equivalent from previous exhibitors | Organiser post-show reports, third-party exhibitor research |
| Cost per qualified lead (benchmarked) | 15% | All-in EUR per qualified lead at typical stand sizes | Internal post-fair reporting, AUMA benchmarks |
| Calendar fit with your sales cycle | 8% | Does fair timing align with buyer fiscal-year cycles? | Industry sales calendars |
| Logistical and travel cost | 8% | Stand, build, travel, hotel, and per-diem totals | Quotation phase, internal models |
A fair scoring above 75 on the weighted total earns a tier-one commitment. A fair between 60 and 75 earns a tier-two commitment. A fair between 50 and 60 earns a tier-three exploratory commitment with a capped budget. Anything under 50 fails the threshold.
Criterion 1: Audience quality
Audience quality is the single most important variable, which is why it carries the heaviest weight. The metric is the declared share of attendees with formal decision-making authority or budget influence for your product category. UFI-audited visitor reports publish this number for over 1,200 European fairs.
A useful sanity check: Hannover Messe drew approximately 127,000 attendees in 2025, with organiser materials describing a strong concentration of decision-makers and influencers for industrial automation procurement; exhibitors should request the current edition’s audited decision-maker share directly from Deutsche Messe rather than rely on an unverified fixed percentage.
Anuga FoodTec declares 89% trade-buyer composition at roughly 50,000 attendees. EuroShop declares 92% trade buyers at 80,000 attendees. Consumer-leaning hybrid fairs publish much weaker numbers: IFA Berlin’s trade-buyer rate sits at roughly 28% of 200,000 attendees, which is still 56,000 trade buyers but means the cost-per-trade-buyer maths is meaningfully different.
“Buyer quality is more important than buyer quantity. A fair where 80 percent of visitors are influencers or decision-makers will outperform a fair with three times the gross attendance and twenty percent qualified visitors, almost without exception, on every metric exhibitors actually care about.”, CEIR 2024 Index Report, executive summary commentary
Score this criterion against the share of attendees with budget authority for your specific category, not the fair’s headline trade-buyer share. A general “trade buyer” at a horizontal industrial fair may have no purchasing power for your specific machine-vision vertical. The visitor segmentation reports published by the larger organisers (Deutsche Messe, Messe Frankfurt, Fiera Milano, RX, Reed) break out attendee profiles by vertical.
Criterion 2: International audience share
Anything labelled a European fair with less than 25% international attendance is a regional show in disguise. EuroShop, drupa, K, Hannover Messe, Bauma, ISE Barcelona, and Anuga consistently sit above 60% international. Niche category fairs like productronica Munich and EMO Hannover sit between 45% and 60%. Regional fairs disguised as European events frequently fail this filter.
The international share matters because most exhibitors are not trying to sell in only their home market. A 70% international visitor share at Hannover Messe means that exhibiting there gives you a one-week sampling of the entire European industrial buyer universe rather than the German-only subset.
Criterion 3: Buyer density per square metre
Buyer density per sqm sounds bureaucratic but is the cleanest single metric for “intensity of the conversation environment.” It equals total qualified visitors divided by net exhibition area. EuroShop runs near 0.55 qualified buyers per sqm-day. Anuga runs near 0.65. Smaller niche fairs can hit above 1.0 buyer per sqm-day. Sprawling horizontal fairs run below 0.30.
Density predicts how much idle time your booth staff will have on the floor. Low-density fairs require larger staffing rosters for the same conversation count because foot traffic spreads thin across the hall. The /staffing-ratios reference at Exhibition Stands EU lists density numbers for the forty most active European B2B fairs and the staffing implications.
Criterion 4: Category authority
Category authority is the qualitative test of whether this is the fair the industry talks about. EMO Hannover is the fair for machine tools, not Bauma, not Hannover Messe. Drupa is the fair for print and converting technology, not productronica, not Light + Building. K Düsseldorf is the fair for plastics and rubber. Bauma is the fair for construction equipment. Anuga is the fair for food and beverage.
These are not just market leaders by attendance; they are the fairs where the industry’s announcements happen, where the awards are presented, and where customers expect to see you.
If a fair carries category authority in your vertical, exhibiting at it is closer to a defensive necessity than a marketing tactic. Score 9 or 10 if the fair is the unambiguous category leader. Score 5 if it competes with one or two other equally credible category fairs. Score 1 if it is a horizontal show where your category appears as a side hall.
Criterion 5: Exhibitor satisfaction from the prior edition
Most organiser-published satisfaction scores skew positive, exhibitors who do not return tend not to fill in surveys. The more reliable signal is repeat-exhibitor share. UFI audits publish this for major fairs. EuroShop’s repeat-exhibitor rate sits above 80%. Hannover Messe’s repeat rate sits above 75%. New or struggling fairs typically run below 50% repeat exhibitors year over year.
The /reviews subsection on each fair’s directory page at Exhibition Stands EU surfaces exhibitor commentary from the prior twenty-four months, segmented by category and stand size.
Criterion 6: Cost per qualified lead
AUMA’s exhibitor benchmark for cost per qualified lead in 2025 sat between EUR 145 (best-in-class on mid-budget fairs) and EUR 680 (worst-decile on premium fairs with low conversation density). Internal post-fair calculations typically replace AUMA’s average with your own brand’s data, which is more reliable.
For new candidate fairs, use AUMA’s category benchmark as the baseline and adjust upward by 20% if the fair has higher hall-rate premiums (Frankfurt, Düsseldorf, Munich tend to sit at the upper end).
| Fair | Typical CPL band (EUR) | Density | International share |
|---|---|---|---|
| Hannover Messe | 180-340 | Medium | 62% |
| Anuga (Cologne) | 140-280 | High | 76% |
| Bauma (Munich) | 220-420 | High | 71% |
| EuroShop (Düsseldorf) | 240-460 | Medium-high | 73% |
| IFA (Berlin) | 280-540 | Low-medium | 48% |
| ISE (Barcelona) | 200-380 | High | 67% |
| drupa (Düsseldorf) | 260-490 | Medium | 81% |
| K (Düsseldorf) | 220-410 | High | 79% |
| EMO (Hannover) | 240-450 | High | 64% |
| Light + Building (Frankfurt) | 230-440 | Medium | 58% |
These figures are observed mid-band ranges from AUMA, exhibitor case studies published by Messe Frankfurt, Deutsche Messe and Messe Düsseldorf, and confidential briefings shared by mid-market European exhibitors at builder roundtables. Brand-specific results vary widely above and below.
Criterion 7: Calendar fit with your sales cycle
A fair whose timing aligns with buyer fiscal-year capex cycles produces better follow-up conversion. Construction and industrial buyers in Europe often lock annual capex commitments by Q1, which makes spring-cycle Bauma (every three years) and Hannover Messe (annual, April) effective lead-generators. Retail buyers lock seasonal range commitments late summer, making September-cycle fairs more productive for retail-tech and packaging suppliers than Q1 events.
Score this criterion against your sales cycle, not against the fair’s calendar slot.
Criterion 8: Logistical and travel cost
The eighth criterion is the practical cost reality. Some fairs come with structurally higher build, freight, hotel, and per-diem costs. Frankfurt hotel rates during Light + Building or Automechanika regularly hit EUR 450 to EUR 700 per night per room. Düsseldorf during K or drupa runs similar premiums.
Barcelona during ISE has compressed massively in hotel availability since the event grew past 80,000 attendees, with hotel premiums running 3x to 4x baseline. Cologne and Munich tend to sit lower on accommodation premiums. Smaller regional centres can run materially cheaper on travel and labour without sacrificing audience quality.
“AUMA’s exhibitor benchmark studies repeatedly show that travel, accommodation and per-diem costs absorb roughly 18 to 28 percent of total participation budget, depending on team size and fair location. Underestimating this line item is the most common budget surprise we see in first-time exhibitor reviews.”, AUMA Exhibitor Survey commentary, 2025 edition
A worked example: pruning twelve candidate fairs to four
Consider a mid-market European packaging machinery exhibitor with a EUR 850,000 annual exhibition budget. The long-list draft is drupa, K, Anuga FoodTec, Interpack, FachPack, IFFA, ProSweets, PPMA, EmpackBirmingham, Anuga (Cologne), All4Pack Paris, and Anuga Horizon. Applying the scorecard:
- drupa (Düsseldorf, every four years): Category authority 10, audience quality 9, international share 9, density 7, CPL 5, exhibitor satisfaction 8, calendar fit 7, logistics 5. Weighted score: 7.8. Tier-one.
- K (Düsseldorf, every three years): Category authority 10, audience quality 9, international 9, density 8, CPL 6, satisfaction 9, calendar 7, logistics 5. Weighted: 8.1. Tier-one.
- Interpack (Düsseldorf, every three years): Category authority 10, audience 9, international 8, density 8, CPL 6, satisfaction 8, calendar 8, logistics 5. Weighted: 8.0. Tier-one.
- Anuga FoodTec (Cologne, every three years): Category 9, audience 9, international 8, density 8, CPL 7, satisfaction 8, calendar 7, logistics 6. Weighted: 7.9. Tier-one.
- FachPack (Nuremberg, annual): Category 7, audience 8, international 5, density 7, CPL 7, satisfaction 7, calendar 8, logistics 7. Weighted: 7.0. Tier-two.
- IFFA (Frankfurt, every three years): Category 8, audience 8, international 8, density 8, CPL 6, satisfaction 7, calendar 6, logistics 5. Weighted: 7.2. Tier-two.
The remaining candidates score below the tier-three threshold or duplicate audience that the tier-one set already covers. The four tier-one commitments consume roughly EUR 620,000 over the budget cycle, leaving headroom for one tier-two exploration and contingency.
How the scorecard handles new and unproven fairs
New fairs lack the audit data the scorecard depends on. The substitute is intent data. Three signals matter:
First, organiser track record. RX Global, Messe Frankfurt, Deutsche Messe, Reed Exhibitions, Informa Markets, IFEMA, Fiera Milano, and Koelnmesse all carry institutional credibility. A new fair from one of these organisers is operationally serious from day one.
Second, the launch exhibitor list. If more than 60% of the announced launch exhibitors are established category leaders rather than aspirational entrants, the organiser has done the pre-sales work credibly.
Third, anchor sponsor and government commitment. A new fair with a named anchor sponsor (typically a category leader contributing EUR 250,000-plus) and ministerial endorsement signals organiser confidence and likely visitor-acquisition spend.
Score new fairs against these three intent signals, treat the resulting weighted score as a probability rather than a guarantee, and cap the exploratory budget at 12% of the annual programme.
“Auditing visitor numbers and exhibitor satisfaction is what protects exhibitors from regional shows pretending to be European events. Eight out of ten fairs claiming European audience reach fail UFI’s international-share threshold when audited. Exhibitors who insist on audited numbers cut their fair-selection failure rate in half.”, UFI Global Exhibition Barometer, 2024 thematic commentary
Common scorecard mistakes
Three mistakes recur. First, weighting visitor headcount over visitor quality. The scorecard explicitly addresses this by separating audience quality and density from gross attendance. Second, scoring on familiarity rather than evidence. Exhibitors who attended a fair five years ago carry imprints of that experience even when the fair has changed materially.
Audit numbers from the most recent edition matter more than reputation. Third, neglecting calendar fit. The best fair in the wrong quarter for your buyer’s fiscal cycle underperforms a tier-two fair timed correctly.
Bringing the scorecard into operational planning
Once the scorecard yields a tier-one set, the next steps are stand-size allocation, booth-design commissioning, and team staffing. The /budget calculator at Exhibition Stands EU helps model per-fair budget envelopes against the scorecard tier output. The /fairs directory lists audited audience profiles for the 250 most active European B2B fairs.
Related reading
- Booking and Stand Location Guide, how to convert tier-one decisions into specific hall-and-position requests
- Booth Staffing Calculator, translating scorecard density numbers into required staff rosters
- Trade Fair Budget Planning, line-item breakdown that feeds the cost-per-lead column
- Sponsorship and Add-On Package ROI, when to layer sponsorship on top of base participation
- Press and Media Relations Playbook, building category authority by piggybacking on tier-one fair coverage
References and primary sources
- AUMA Exhibitor Outlook (Association of the German Trade Fair Industry), auma.de
- UFI Global Exhibition Barometer, editions 32 through 34, 2024-2025, ufi.org
- CEIR Index Report 2024 (Center for Exhibition Industry Research), ceir.org
- EMECA (European Major Exhibition Centres Association) audited visitor reports, emeca.eu
- Messe Frankfurt Visitor Research Reports, exhibitor briefing series 2024-2025
- Deutsche Messe Hannover Messe post-show analytics, public exhibitor reports
- RX Global exhibitor performance index, 2025 edition
- ESSA (Event Supplier and Services Association) industry guidance, essa.uk.com
FAQFrequently asked questions
AUMA’s 2025 exhibitor survey puts the modal answer at three to five fairs annually for mid-market B2B brands and seven to twelve for enterprise exhibitors with international ambitions. The number matters less than the calendar logic. Two well-chosen fairs delivering 600 qualified conversations each beat seven fairs delivering 150 conversations each, both on cost-per-lead and on follow-up bandwidth.
The scorecard methodology in this article is designed to prune long-lists down to the three to seven fairs that genuinely move pipeline.
Choosing the fair with the highest absolute visitor number rather than the highest density of the right visitor. A 200,000-visitor consumer-leaning fair with a 4% trade buyer rate delivers 8,000 trade visitors; a 35,000-visitor niche fair with 78% qualified buyer rate delivers 27,300. The niche fair wins on every meaningful axis except headline marketing claims. UFI’s Global Exhibition Barometer has flagged this ‘attendance vanity’ bias in three consecutive surveys.
Commit your tier-one fairs 14 to 18 months ahead, your tier-two fairs 9 to 12 months ahead, and leave your tier-three explorations on a 4 to 6 month decision horizon. Tier-one slots at Hannover Messe, Bauma, EuroShop, drupa, K, Anuga, ISE and IFA close at premium positions within weeks of the previous edition closing. Late commitments routinely cost 20 to 35% more in space rate and force corner or hall-edge positions.
Five matter consistently across European fairs: declared decision-making authority of attendees (UFI calls this ‘commercial purchasing power’), repeat-visitor share, international visitor share (anything under 25% for a ‘European’ fair is a regional show in disguise), session-time-on-floor, and exhibitor satisfaction-score from the previous edition.
Organisers publish four of these in audit reports certified under UFI’s auditing scheme. The fifth, session time, usually has to be inferred from peak-density hours or asked of previous exhibitors.
Yes, usually. Competitor-heavy fairs are competitor-heavy because that is where the buyers are. The strategic question is not whether competitors attend but whether you can credibly differentiate inside that environment.
CEIR research on category-killer fairs (drupa, K, EMO, Bauma) shows that fairs where the top five exhibitors hold over 40% of the stand area still deliver positive ROI for tier-two and tier-three exhibitors who match positioning to the audience expectation rather than copying tier-one execution.
New fairs score on intent rather than evidence.
Three signals matter: the organiser’s track record at other fairs (Messe Frankfurt, RX Global, Reed Exhibitions, Informa Markets, IFEMA all carry credibility), the launch exhibitor list (more than 60% commitment from established category players signals organiser strength), and the venue-level marketing commitment (named anchor sponsors, ministerial presence, hosted-buyer programme funding).
A new fair scoring above 60 on the intent column deserves a tier-three exploratory commitment with capped budget.