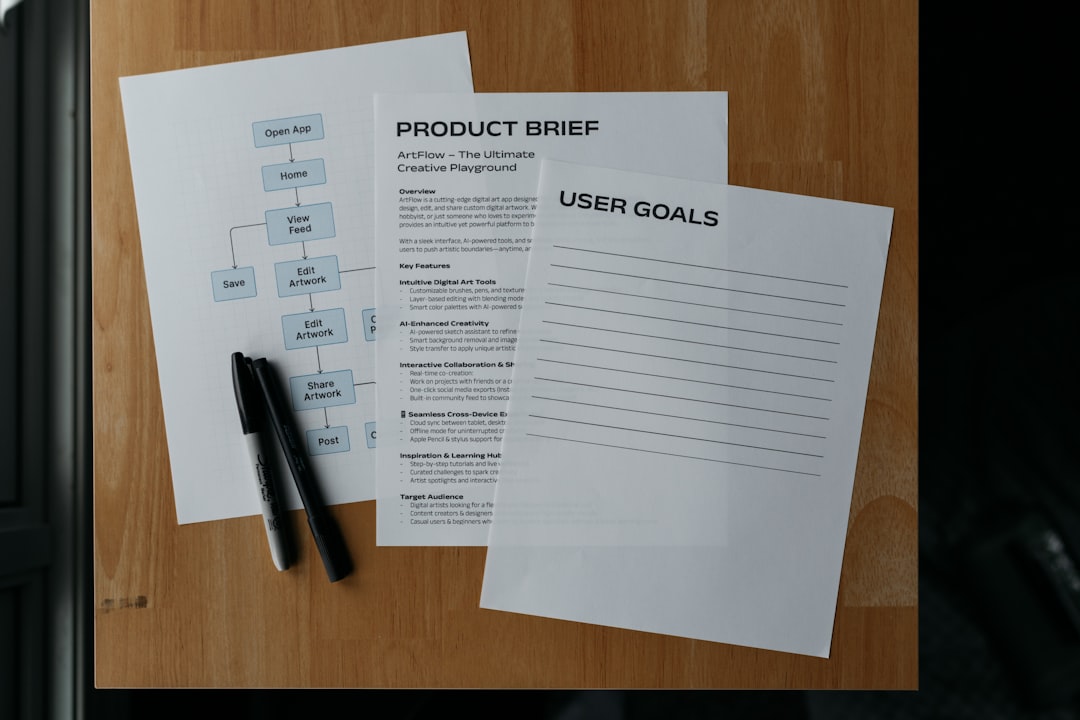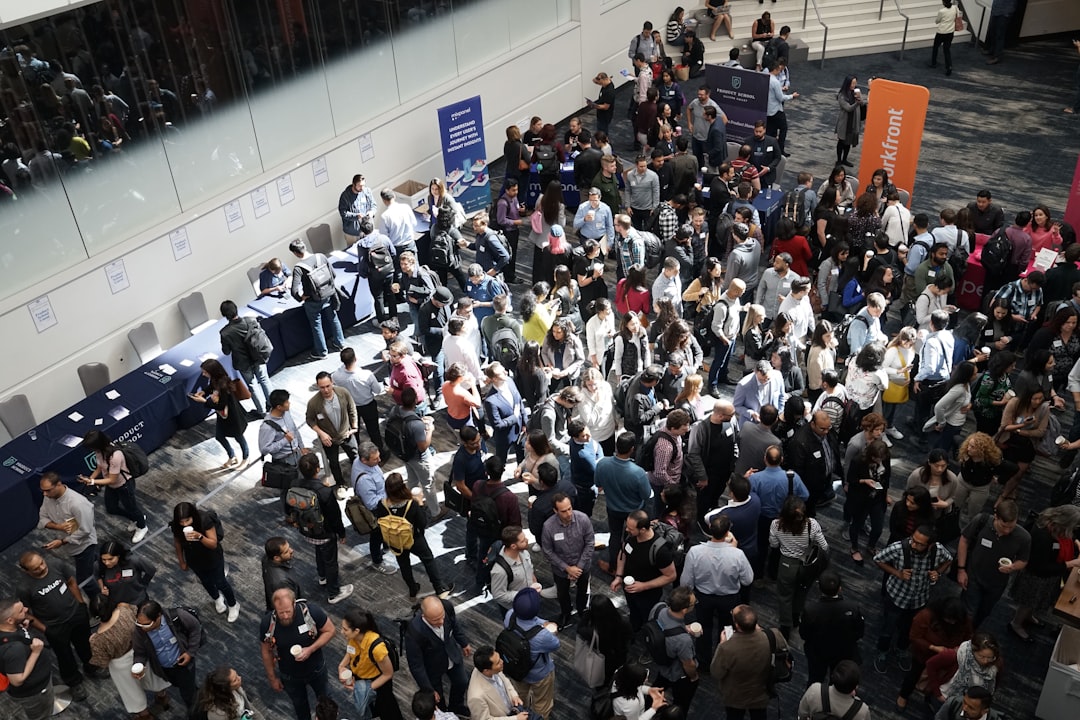
Trade fair appearances without clearly articulated objectives consistently underperform fair appearances with structured objectives by 2-3x on every measurable outcome. The reason is structural rather than motivational: without objectives, every operational decision, booth design, staffing, messaging, pre-show targeting, post-show follow-up, defaults to generic best-practice rather than goal-aligned execution.
The team that knows the fair exists to acquire 240 enterprise leads from DACH manufacturing organisations operates differently from the team that knows the fair exists to generally “promote the brand.”
This article documents the objective-setting framework that experienced European exhibition organisations use: how to cascade board-level strategic goals into fair-level objectives, how to construct SMART targets that drive execution, and how to handle the four most common fair-objective scenarios, product launch, market entry, brand investment, and pipeline acceleration, at European tier-one fairs.
The strategic cascade: from board to fair-floor
Effective fair objectives sit inside a three-level cascade.
Level 1, Board-level strategic goal. Examples: “Establish category leadership in industrial automation in DACH by 2027.” “Achieve 30 percent revenue from net-new accounts.” “Launch the new product line with EUR 8M of qualified pipeline in the first 12 months.”
Level 2, Marketing portfolio objective. Each strategic goal translates to one or more marketing objectives. The portfolio objective specifies how the marketing function will contribute. Examples: “Deliver 60 percent of new-account pipeline through trade fair channels.” “Achieve 24:1 pipeline ratio for product-launch fair appearances.” “Build measurable category awareness in DACH industrial manufacturing decision-makers.”
Level 3, Per-fair objectives. Each fair appearance has three to five specific objectives that contribute to the portfolio objective. These are the operational anchors for the fair team. Examples: “Capture 280 net-new leads from DACH-headquartered industrial manufacturers.” “Achieve 22 percent demo-to-meeting conversion.” “Deliver 35 percent above-75 score distribution.”
The cascade ensures that fair-floor execution traces upward to board-level strategy. The team running a 28-minute MEDDIC qualification conversation knows why they are running it: because the per-fair objective requires above-75 score distribution, which requires Champion identification rate above 35 percent, which requires MEDDIC-trained qualification, which contributes to portfolio pipeline ratio, which contributes to the board-level strategic goal.
“The fair appearance that lacks documented objectives is not really a fair appearance; it is a fair attendance. The objectives transform attendance into investment with measurable outcomes. The discipline of writing them down is what makes the fair worth the budget.”, common framing among strategic-planning practitioners
SMART objectives at fair pace
The SMART framework (Specific, Measurable, Achievable, Relevant, Time-bound) is the operational standard for fair-objective construction. Applied to trade fairs:
Specific. The objective names a specific outcome, audience, and context. “Capture 280 leads from DACH industrial manufacturing companies with 250+ employees, decision-makers or strong influencers” is specific. “Get more leads” is not.
Measurable. Every objective has a numeric target attached. “280 leads” is measurable. “Lots of leads” is not.
Achievable. The target is calibrated against benchmarks and prior performance. “280 leads” is achievable if prior cycles delivered 240-310 and this cycle increases pre-show investment by 15 percent. “1,200 leads” from the same baseline is not.
Relevant. The objective contributes to a stated portfolio objective and board-level goal. “280 enterprise leads” contributes to the new-account pipeline goal; “280 student researcher contacts” does not.
Time-bound. The measurement window is explicit. “By 90 days post-fair” for capture-to-opportunity conversion; “by 12 months post-fair” for pipeline ratio.
A well-constructed fair objective in SMART form:
“Capture 280 qualified leads (score ≥55) from DACH-headquartered industrial manufacturing companies with 250+ employees, decision-influencer or above, by end of Hannover Messe day 5, with 32 percent of captured leads converting to qualified opportunities within 90 days post-fair, contributing EUR 12.4M of pipeline in the 12-month measurement window.”
That single objective specifies audience, volume, quality threshold, timing, and downstream conversion. It drives operational planning across pre-show targeting, on-stand staffing, qualifier scripts, and post-show follow-up.
The four common fair-objective scenarios
European exhibitors typically face four distinct objective scenarios per fair, each with different operational implications.
Scenario 1: Product launch
A new product appears at the fair, often timed to the fair as the launch moment. Strategic goal: maximise pipeline activation against the new product in its first 12 months.
Typical objectives:
- Capture 200-350 new-product-interested leads with above-55 score
- Achieve 25-40 percent demo completion rate for new-product demos
- Generate 40-80 fair-week press mentions or industry analyst meetings
- Book 30-60 post-show technical deep-dive meetings within 30 days
Operational implications: Pre-show marketing weighted toward awareness and demo bookings; on-stand staffing weighted toward demo specialists; capture qualifiers include product-specific interest fields; post-show sequence has product-launch content track.
Representative European launches: TechElectronics company launching new IoT platform at productronica; pharmaceutical instrumentation company launching at Analytica; consumer goods packaging innovation launch at Anuga.
Scenario 2: Market entry
The fair is the launch point for a new geographic market or industry vertical. Strategic goal: build initial pipeline and brand recognition in the new market.
Typical objectives:
- Capture 150-280 leads from the target new market geography or vertical
- Identify 20-40 potential channel partners or distributors
- Generate 8-15 named-account meetings with target enterprise prospects
- Achieve 30 percent above-75 score on captured leads to validate audience-fit
Operational implications: Pre-show marketing weighted toward LinkedIn ABM in target geography or vertical; on-stand staffing includes native-language speakers and senior business development; capture qualifiers include channel-partner-fit fields.
Representative European examples: US technology company entering DACH market at Hannover Messe; Asian manufacturing company entering European industrial market at EMO Hannover; UK fintech entering French market at Vivatech Paris.
Scenario 3: Brand investment
The fair is part of a long-term brand-building strategy where pipeline outcomes are secondary to category positioning. Strategic goal: establish or reinforce category leadership in a specific buyer audience.
Typical objectives:
- Achieve 60-120 named press, analyst, and industry-figure meetings
- Deliver 8-15 panel or keynote speaking moments
- Generate 5-12 million fair-week brand impressions across owned and earned media
- Capture 100-200 brand-engaged leads as a pipeline by-product
Operational implications: Booth design weighted toward brand expression and hospitality; on-stand staffing weighted toward senior executives, content creators, hospitality leads; capture qualifiers lighter than lead-generation fairs.
Representative European brand investments: Luxury watch brands at Watches & Wonders Geneva; design furniture brands at Salone del Mobile; aerospace and defence firms at Salon du Bourget.
Scenario 4: Pipeline acceleration
The fair is leveraged to accelerate existing pipeline opportunities. Strategic goal: shorten sales cycles and increase win rates on opportunities already in motion.
Typical objectives:
- Conduct 40-80 scheduled meetings with named active-opportunity contacts
- Deliver 25-50 technical deep-dives moving deals through procurement gates
- Achieve 15-30 executive-to-executive meetings advancing C-level sign-off
- Reduce average sales cycle by 30-60 days on fair-participating opportunities
Operational implications: Pre-show calendar-booking weighted toward existing opportunities; on-stand staffing includes named account executives and senior technical resources; capture qualifiers minimal because the relationships are already in CRM.
Representative pipeline-acceleration plays: Enterprise software vendors using EuroShop or NRF Big Show as procurement-cycle accelerators; industrial automation firms using Hannover Messe for capex-committee engagements; cybersecurity firms using infosec fairs for security-team alignment moments.
Worked example: objective-setting for a Hannover Messe appearance
A mid-size European B2B industrial automation company planning Hannover Messe with the following strategic context: board-level goal to achieve 35 percent revenue from new accounts in DACH manufacturing, marketing portfolio objective to deliver 60 percent of new-account pipeline through trade fairs, prior-cycle Hannover Messe performance of EUR 8.2M attributed pipeline.
The five per-fair objectives:
Objective 1 (pipeline volume). Capture 320 qualified leads (score ≥55) from DACH-headquartered manufacturing companies with 200+ employees, decision-influencer or above, by end of Hannover Messe day 5, with 22 percent converting to qualified opportunities within 90 days post-fair.
Objective 2 (pipeline value). Generate EUR 9.5M of multi-touch-attributed pipeline within 12 months of fair close, representing 16 percent year-over-year growth from prior cycle.
Objective 3 (product launch). Achieve 120 captured leads explicitly interested in the new IoT-integrated controller platform launched at the fair, with 40 percent rating the demo experience as differentiated against alternatives.
Objective 4 (account engagement). Conduct 48 scheduled meetings with named active-opportunity accounts in pipeline above EUR 200K, advancing 60 percent through at least one stage gate within 60 days post-fair.
Objective 5 (operational learning). Validate the new lead-scoring v2 model by comparing post-fair conversion rates against prior-cycle v1 model; document v2 calibration adjustments for next-fair deployment.
Each objective rolls up to the portfolio objective (deliver new-account pipeline through trade fairs) which rolls up to the board-level goal (35 percent revenue from new accounts in DACH manufacturing). Every operational decision during fair planning traces to one or more of these five objectives.
“Trade fair objectives that cannot be cascaded to board-level strategic goals usually fail to defend the fair budget at year-end review. The cascade is not bureaucratic; it is the document that turns fair attendance into measurable contribution to corporate strategy.”, common framing among strategic marketing practitioners
Calibrating targets against benchmarks
For each numeric target in an objective, the calibration question is: is this target ambitious enough to matter and realistic enough to achieve?
The benchmark sources documented separately (AUMA, CEIR, UFI, McKinsey/Bain) provide the ambition reference. Internal prior-cycle performance provides the realism reference. The defensible target lands between the two.
| Target | Benchmark reference | Internal baseline | Target |
|---|---|---|---|
| Captured leads | Industry top-quartile estimate ~620-850 per 100 sqm | Prior-cycle: 740 | Target: 800 (+8%) |
| Lead-to-opportunity rate | Industry top-quartile estimate 18-23% | Prior-cycle: 19% | Target: 22% |
| Pipeline ratio | Industry top-quartile estimate 8-12:1 | Prior-cycle: 16:1 | Target: 18:1 |
| 72-hour SLA | Industry best-practice estimate 94%+ | Prior-cycle: 92% | Target: 96% |
The targets push from internal baseline toward benchmark ceilings without setting unrealistic expectations. Year-over-year improvement of 8-15 percent on the headline metrics is the defensible ambition for an organisation already operating at top-quartile benchmarks.
Per-fair vs portfolio-level objective integration
The five per-fair objectives feed the portfolio-level objectives, which in turn feed the strategic goals. Sample portfolio-level objective set for an annual fair calendar:
| Portfolio objective | Target | Per-fair contribution |
|---|---|---|
| Total attributed pipeline | EUR 22M | Hannover Messe 9.5M + EuroShop 6.8M + Light+Building 3.8M + Regional 1 1.4M + Regional 2 0.5M |
| Portfolio pipeline ratio | 17.1:1 | Weighted by per-fair cost |
| Total qualified leads (≥55) | 2,400 | Distributed proportional to fair size |
| New-account share of pipeline | 60% | Per-fair new-account capture targets |
| 72-hour SLA adherence | 96% | All fairs meeting the SLA target |
The portfolio targets are the rollup; per-fair targets are the components. Both must be set together at the start of the planning cycle to ensure alignment.
Objective review cadence
Objectives are reviewed at four points in the fair cycle:
Pre-fair planning (T-minus 8-12 weeks). Objectives are documented, signed off by marketing director and stakeholders, distributed to the team.
Mid-fair check (during fair-week). Daily huddles compare actual operational metrics against the trajectory implied by the objectives. Adjustments made if necessary.
Post-fair retrospective (week 1-2 after fair). Captured outputs are measured against objectives. Pipeline-related objectives are still provisional at this point.
12-month review. Final objectives measurement with full pipeline conversion. Findings feed next-cycle objective-setting.
The four-point cadence converts objectives from planning documents to operational anchors to measurement frameworks to learning inputs. Each step matters; skipping any step degrades the discipline.
Common objective-setting failures
- Objectives stated as activities, not outcomes. “Have a stand at Hannover Messe” is an activity; “capture 320 qualified leads at Hannover Messe” is an outcome.
- Objectives without measurable targets. “Improve brand awareness” with no metric is unfalsifiable.
- Too many objectives. Above five objectives, the team cannot maintain focus.
- Objectives disconnected from portfolio strategy. Fair-level objectives that do not roll up to portfolio or strategic goals lack purpose.
- Targets not calibrated against benchmarks. Either unambitious (no growth signal) or unrealistic (sets the team up for failure).
- No mid-cycle adjustment. Objectives are not legal contracts; mid-cycle reality should inform whether they need re-baselining.
- Brand-investment fairs treated identically to lead-generation fairs. Different objective scenarios require different objective structures.
Integration with the broader strategy
The objective-setting framework is the planning anchor for every other element of the exhibition strategy.
Objectives drive pre-show marketing targeting, lead capture systems configuration, lead qualification and scoring calibration, and post-show follow-up execution.
They are the basis for budget defense conversations and feed the KPI framework executive dashboard.
For deeper coverage of adjacent topics, see our ROI measurement methodology, our account-based event marketing playbook, our competitive intelligence at fairs framework, our builders directory, our calculator for budget modelling, and our RFQ tool.
References
- Center for Exhibition Industry Research (CEIR) research on exhibitor planning practice, 2024.
- UFI Global Exhibition Barometer, 32nd edition. Strategic objectives benchmarks. 2025.
- AUMA Exhibitor Outlook 2024-2026, Association of the German Trade Fair Industry, auma.de.
- McKinsey & Company commentary on strategic objective cascades for B2B event marketing, 2024.
- Harvard Business Review commentary on writing objectives that drive execution, 2024.
- Bain & Company commentary on marketing objectives and board-level scrutiny, 2024.
- Forrester (formerly SiriusDecisions) B2B marketing planning frameworks.
- Forrester Research commentary on European B2B marketing strategy, 2024.
FAQFrequently asked questions
Objectives describe what the fair appearance should achieve strategically; targets are the measurable numeric expressions of progress toward those objectives.
An objective is ‘establish category leadership in DACH for our new product line’; a target is ‘capture 240 qualified leads from DACH-headquartered companies with the new product as their stated interest area, with at least 35 percent rating the demo experience as differentiated.’ Objectives drive the strategic conversation; targets drive the operational execution.
The discipline is making sure every objective has at least two measurable targets attached to it, and that every target rolls up to a stated objective.
Three to five objectives per fair is the manageable range. Below three, the fair lacks strategic richness and the team underutilises the opportunity. Above five, the team cannot maintain focus and execution quality degrades across all objectives.
The three-to-five range typically covers: one or two pipeline objectives (lead capture, opportunity creation), one brand or category objective (market positioning, product launch), one customer or partner objective (existing-customer engagement, partner program advancement), and occasionally one operational learning objective (testing a new market, validating a product hypothesis).
Both levels are necessary. Portfolio-level objectives capture the cross-fair strategy: ‘achieve 18:1 portfolio pipeline ratio, with portfolio cost-per-qualified-lead under EUR 350.’ Per-fair objectives translate the portfolio strategy to specific fairs: ‘Hannover Messe specifically should deliver 280 enterprise-segment leads with 12 percent above 75 score.’
The portfolio level governs budget allocation across fairs; the per-fair level governs execution at each fair. Setting only one level produces either tactical drift (per-fair only) or strategic disconnection (portfolio only).
Three sources support first-fair target-setting: industry benchmarks from CEIR and UFI for fair-type and size; competitive intelligence on what competitors at the fair typically achieve (gathered through agency partners or industry network); and conservative discount from your portfolio average to account for execution learning curve.
A defensible approach is to set first-fair targets at 65-75 percent of portfolio benchmarks, with an explicit commitment to recalibrate after the first cycle. First-fair underperformance against portfolio targets is expected and should not trigger negative consequences; it provides the empirical baseline for second-cycle targets.
Yes, but appropriately weighted. A pure brand-investment fair like Salone del Mobile or Watches & Wonders Geneva should still have measurable pipeline targets to validate that brand investment translates to pipeline activation; however, the pipeline targets should carry lower weight in the overall objective set than awareness, brand-equity, and category-positioning metrics.
The mistake to avoid is either dismissing pipeline measurement at brand fairs (which removes accountability) or applying pure-pipeline targets identically to brand fairs and to lead-generation fairs (which mis-rewards executions that are inappropriate for the fair type).
Multi-cycle objectives are common for product-launch sequences, market-entry programs, and account-based engagement campaigns. Document the multi-cycle objective at the portfolio level with explicit phase markers per fair cycle. Phase 1: brand introduction at Fair A. Phase 2: opportunity creation at Fair B six months later. Phase 3: pipeline acceleration at Fair C twelve months later.
Each phase has its own targets that contribute to the overall multi-cycle objective. The phasing prevents the team from expecting Phase 3 outcomes at Phase 1 fairs, which is a common failure mode that leads to abandoning otherwise sound multi-cycle strategies.