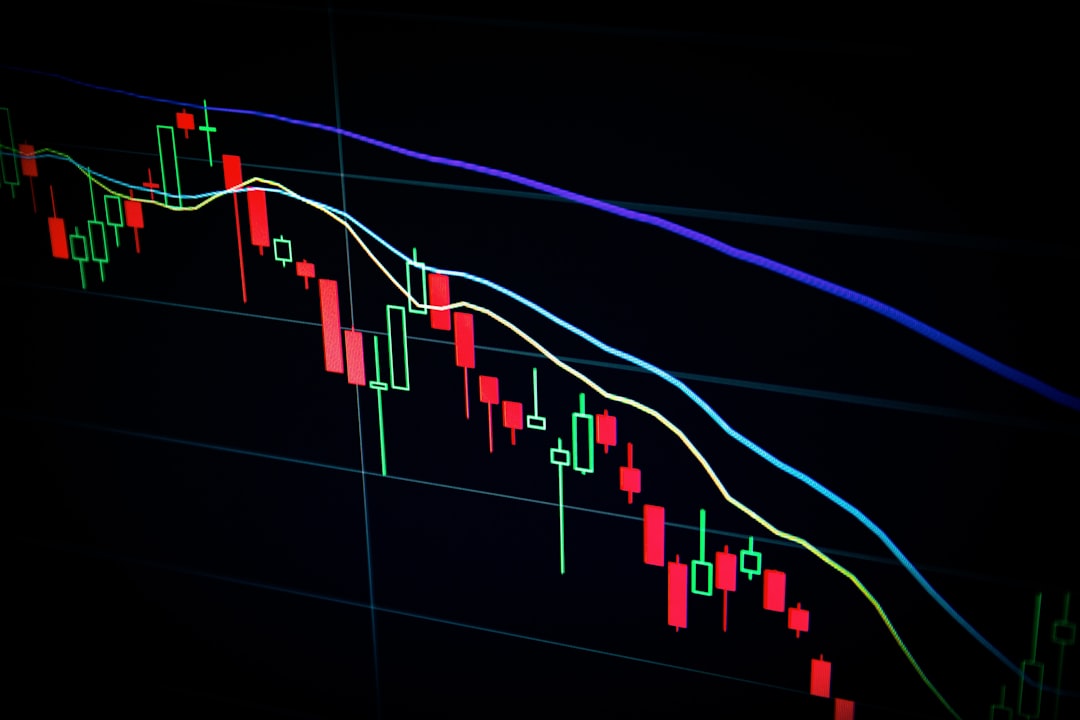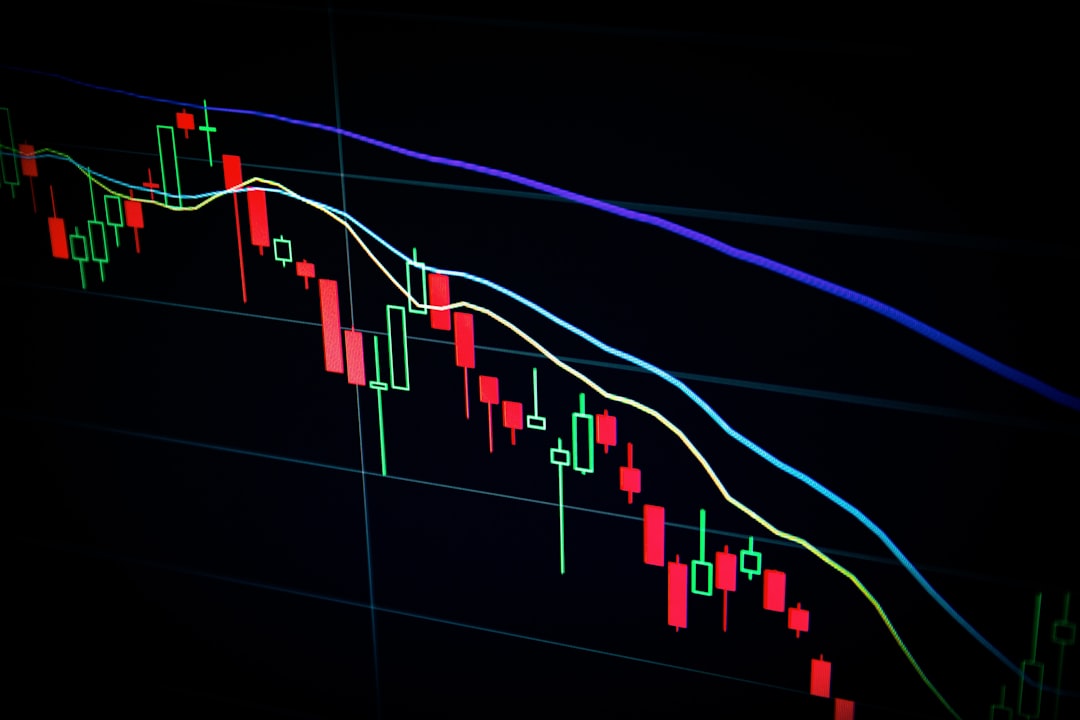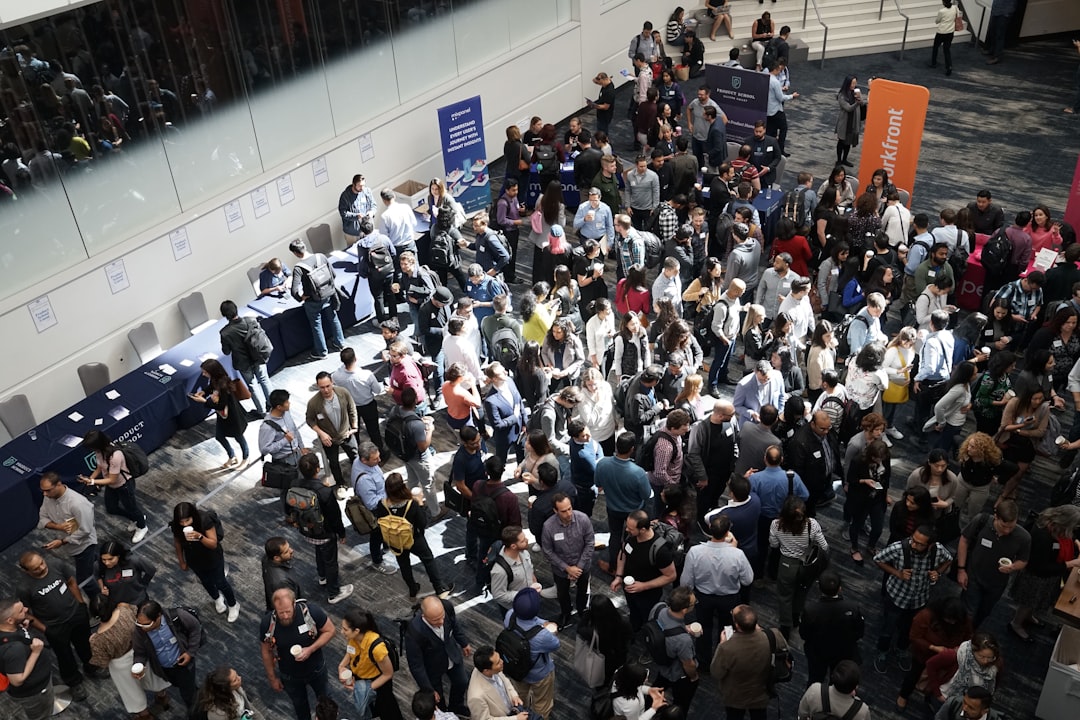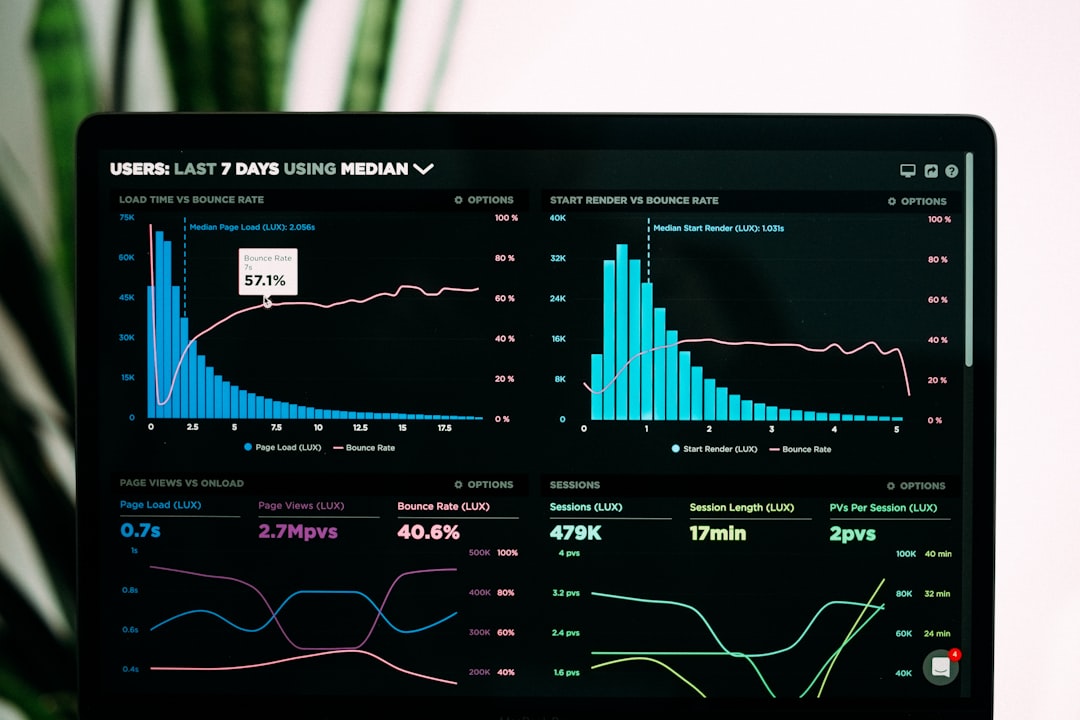
Attribution methodology determines whether a EUR 400,000 fair appearance shows up in the CFO dashboard as a 12:1 ROI winner or a 3:1 ROI laggard. The fair itself does not change; only the attribution model changes. Exhibitors who lose the budget defence usually lose it because the attribution model in use under-credits trade fairs while over-crediting digital channels with cleaner tracking.
This article documents the multi-touch attribution models that work for European B2B trade fair pipeline, the weighting tables that calibrate them, the CRM configuration to deploy them, and the executive-level conversation that gets CFO and CRO alignment on the methodology before results are reported.
Why attribution methodology matters more than execution quality
Two exhibitors with identical fair performance can report ROI figures that differ by a factor of five depending on attribution methodology. The first exhibitor uses last-touch attribution: the fair receives zero credit because the final pre-conversion touch was a sales call three weeks after the fair. ROI: 0.4:1, the fair looks like a budget sink.
The second exhibitor uses first-touch attribution: the fair receives 100 percent credit because it was the first qualifying touch. ROI: 18:1, the fair looks like the marketing crown jewel.
The truth is somewhere in the middle, and multi-touch attribution is the discipline of finding it. A properly calibrated U-shaped or W-shaped multi-touch model gives the fair the credit it deserves, typically 30-45 percent of fair-influenced revenue, without overstating its role in deals where multiple channels contributed.
“Attribution is the most under-resourced and most consequential discipline in B2B marketing measurement. Channels with cleaner tracking systematically claim revenue from channels with messier tracking. Trade fairs, with no last-touch digital signal, are the canonical victim of this dynamic across European B2B.”, common framing among B2B marketing attribution practitioners
The five primary attribution models compared
| Model | How it works | Trade fair credit | Use case |
|---|---|---|---|
| First-touch | 100% to first marketing touch | High (when fair is first) | Brand-investment campaigns |
| Last-touch | 100% to last touch before conversion | Near zero | Quick-conversion campaigns |
| Linear | Equal weight across all touches | Moderate | Long-cycle multi-touch journeys |
| U-shaped (position-based) | 40% first, 40% last, 20% middle | Moderate-high | Trade-fair-driven motions |
| W-shaped | 30% first, 30% opportunity-creation, 30% last, 10% middle | High when fair drives opportunity creation | Complex enterprise deals |
| Time-decay | Recent touches weighted more | Low | Short-cycle deals |
| Data-driven (algorithmic) | ML model assigns weights | Variable | High-volume B2C / low-consideration |
For European B2B trade fair pipeline, the U-shaped and W-shaped models are the defensible choices. Both give the fair credit proportional to its actual influence: substantial when the fair is the first qualifying conversation (which is typical), additional credit when the fair is also the opportunity-creation moment (which is common in pre-booked-meeting scenarios), and zero claim on the closing touch (which is correctly credited to sales).
The U-shaped model in detail
The U-shaped (position-based) model assigns:
- 40% weight to the first qualifying touch
- 40% weight to the last touch before conversion
- 20% weight distributed equally across all middle touches
For a typical fair-influenced deal with the following touch sequence:
- Pre-show LinkedIn impression (T-minus 5 weeks)
- Pre-show email open (T-minus 4 weeks)
- Pre-show email click (T-minus 3 weeks)
- Fair-floor conversation (T-zero) [opportunity created here]
- Post-show email open (T+24 hours)
- Post-show rep call (T+48 hours)
- Demo session (T+12 days)
- Pricing discussion (T+45 days)
- Final sales call (T+90 days) [closed-won]
U-shaped attribution credits:
| Touch | Position | Weight |
|---|---|---|
| Pre-show LinkedIn impression | First | 40% |
| Pre-show email open | Middle | 2.86% |
| Pre-show email click | Middle | 2.86% |
| Fair-floor conversation | Middle | 2.86% |
| Post-show email open | Middle | 2.86% |
| Post-show rep call | Middle | 2.86% |
| Demo session | Middle | 2.86% |
| Pricing discussion | Middle | 2.86% |
| Final sales call | Last | 40% |
But for a B2B trade fair pipeline this distributes the fair credit poorly because the fair was the qualifying moment, not the first impression. Most experienced European exhibitors configure the U-shaped model to treat the fair touch as the first qualifying touch (not the first marketing impression), which gives the fair 40 percent rather than 2.86 percent.
The W-shaped model in detail
W-shaped attribution adds opportunity-creation as a third high-weight touch:
- 30% weight to the first qualifying touch
- 30% weight to opportunity-creation touch
- 30% weight to the last pre-conversion touch
- 10% weight distributed across middle touches
For the same touch sequence:
| Touch | Position | Weight |
|---|---|---|
| Pre-show LinkedIn impression | First marketing | 0% (not qualifying) |
| Pre-show email open | Middle | 1.43% |
| Pre-show email click | Middle | 1.43% |
| Fair-floor conversation | First qualifying + opportunity creation | 60% (30%+30%) |
| Post-show email open | Middle | 1.43% |
| Post-show rep call | Middle | 1.43% |
| Demo session | Middle | 1.43% |
| Pricing discussion | Middle | 1.43% |
| Final sales call | Last | 30% |
The W-shaped model captures the reality that the fair both qualified the lead and created the opportunity, justifying the 60 percent combined weight. This is the model most experienced European B2B trade fair exhibitors use for opportunity attribution and pipeline reporting.
“The W-shaped model is a common attribution methodology used to credit trade fairs without distorting other channels. The first-touch and opportunity-creation positions are often both at the fair; the last touch typically goes to sales. Middle touches keep some credit but do not dominate the picture.”, common framing among B2B attribution practitioners
Weighting calibration for European tier-one fairs
Different fairs justify slightly different weighting based on the typical role of the fair in the deal cycle.
| Fair | Typical role | Recommended weighting |
|---|---|---|
| Hannover Messe | First qualifying + opportunity creation | W-shaped (60% fair) |
| EuroShop | First qualifying + opportunity creation | W-shaped (60% fair) |
| MWC Barcelona | First qualifying (opportunity often later) | U-shaped (40% fair) |
| Anuga | First qualifying + opportunity creation | W-shaped (60% fair) |
| IFA Berlin | First impression (qualifying often later) | U-shaped with first-touch credit |
| Salone del Mobile | Brand reinforcement + occasional qualifying | Linear or U-shaped (40% fair) |
| Light+Building | First qualifying + opportunity creation | W-shaped (60% fair) |
| Ambiente | First qualifying for trade buyers | W-shaped (60% fair) |
| productronica | First qualifying + opportunity creation | W-shaped (60% fair) |
| Bauma | First qualifying for heavy industry | W-shaped (60% fair) |
The variation reflects audience dynamics. Industrial and B2B fairs (Hannover Messe, EuroShop, Anuga, Light+Building, Bauma) tend to drive both qualifying conversations and opportunity creation at the fair itself. Consumer-mix fairs (IFA, MWC) more often start the relationship but rely on post-show motions for opportunity creation.
CRM configuration
HubSpot. Native multi-touch attribution available out of the box. Configure attribution reports under “Reports > Analytics Tools > Marketing Analytics > Attribution Reports.” Choose U-shaped or W-shaped model. Tag fair touches as a distinct campaign type for clean filtering. Configuration time: 4-8 hours.
Salesforce. Three paths:
- Salesforce Campaign Influence (native). Configure custom influence models with weighting. Free with Sales Cloud Enterprise. Reasonable for mid-market exhibitors.
- Marketing Cloud Account Engagement (Pardot). B2B-specific attribution with native U-shaped and W-shaped support. Pricing applies.
- Adobe Marketo Measure (formerly Bizible). Enterprise-grade attribution platform with full multi-touch modelling. Higher cost; appropriate for enterprise exhibitors.
Configuration time: 12-40 hours depending on path chosen.
Other platforms. Dreamdata, Demandbase, Full Circle Insights, and ChannelMix offer specialised B2B attribution. For exhibitors running complex multi-product attribution across multiple fair cycles annually, the specialised tools deliver substantially better insight than native CRM attribution.
The CFO and CRO alignment conversation
The single most important step in attribution implementation is the upfront alignment meeting with CFO and CRO. The conversation should cover:
Why the current attribution methodology is inadequate. Specifically: which channels are systematically under-credited (typically trade fairs, brand campaigns, content marketing); which are over-credited (typically last-touch channels with clean tracking).
Which methodology will be adopted. U-shaped or W-shaped, with specific weights documented.
How fair touches will be defined. When does a fair conversation become an “attributable touch”? Typically: badge scanned + qualification fields populated above threshold.
What measurement window applies. Standard recommendation: 12 months from fair date.
What governance prevents methodology drift. Annual review only, with documented rationale for any changes.
What reports will be produced. Quarterly fair-portfolio ROI with the agreed methodology; annual deep-dive review.
The output of the meeting is a written policy document signed by CFO, CRO, and CMO. Without this document, methodology disputes resurface every quarter; with it, the conversation moves to execution rather than methodology.
“The attribution methodology is the contract between marketing, sales, and finance. Without a signed contract, every quarter becomes a renegotiation. With it, the executive conversation moves to actual performance and away from accounting arguments.”, common framing among marketing-finance alignment practitioners
Worked attribution example
A representative B2B opportunity closed at EUR 145,000 with the following touch history over 8 months:
| Touch | Date | Channel |
|---|---|---|
| LinkedIn ad impression | -5 weeks | Pre-show LinkedIn |
| Email open | -4 weeks | Pre-show email |
| Email click | -3 weeks | Pre-show email |
| Pre-booked meeting | Fair day 2 | Fair |
| Demo at stand | Fair day 2 | Fair |
| Post-show email reply | T+1 day | Post-show email |
| Discovery call | T+1 week | Sales |
| Technical demo | T+4 weeks | Sales |
| Procurement discussion | T+10 weeks | Sales |
| Contract signed | T+8 months | Sales |
Last-touch attribution: EUR 145,000 to sales (contract signed call). Trade fair credit: EUR 0.
First-touch attribution: EUR 145,000 to pre-show LinkedIn. Trade fair credit: EUR 0.
U-shaped attribution (40/20/40 with fair as first qualifying):
- Pre-show LinkedIn: ignored (treated as awareness)
- Pre-show email open: 5% (middle, distributed across 4 middle touches)
- Pre-show email click: 5%
- Fair pre-booked meeting + demo: 40% (first qualifying, combined)
- Post-show email reply: 5%
- Discovery call: 5%
- Technical demo: 5%
- Procurement discussion: 5%
- Contract signed: 40% (last)
- Trade fair credit: 40% × EUR 145,000 = EUR 58,000
W-shaped attribution (30/30/30/10 with fair as first qualifying + opportunity creation):
- Pre-show touches: 3.33% combined
- Fair: 60% (first qualifying + opportunity creation, combined)
- Post-show + sales touches: 6.67% combined
- Contract signed: 30%
- Trade fair credit: 60% × EUR 145,000 = EUR 87,000
For a single opportunity, the methodology choice between U-shaped and W-shaped moves trade fair credit from EUR 58,000 to EUR 87,000. Across 156 fair-influenced opportunities in a typical Hannover Messe cycle, the methodology choice moves total fair credit by roughly EUR 4.5M-5.8M. This is why the methodology decision matters more than execution improvements at the margin.
Self-reported attribution as a validation layer
Multi-touch CRM attribution measures what was tracked. Self-reported attribution captures what the buyer remembers. The two should be cross-validated.
The implementation: a single question on the demo-request or contact form (“How did you first hear about us?”) with closed-list options including specific fairs. Aggregate the responses by source. Compare to CRM-measured first-touch attribution. The two should align within roughly 15-25 percent; larger divergences indicate either tracking gaps (favouring CRM under-attribution) or recall bias (favouring self-report over-attribution).
Best-practice European exhibitors run both measurements quarterly and use the divergence as a quality signal on the tracking layer.
Common attribution failures
- Last-touch only. Systematically under-credits trade fairs by 60-80 percent.
- No fair-touch tagging in CRM. Fair conversations are invisible to the attribution engine.
- Methodology changes mid-year. Destroys trend credibility with executives.
- No CFO sign-off on methodology. Quarterly methodology disputes derail budget conversations.
- Same-quarter ROI reporting. Long-cycle B2B pipeline has not yet developed; the picture is misleading.
- Single attribution model across all deal types. Enterprise deals benefit from W-shaped; transactional deals are better served by linear or time-decay.
Integration with the broader strategy
The attribution methodology is the operating system under the ROI calculation worked example. It depends on touch capture from lead capture systems and feeds the budget defense framework and KPI framework.
It also informs objective setting by clarifying which fair touches drive which opportunity outcomes.
For deeper coverage of adjacent topics, see our exhibition strategy hub, our pre-show marketing playbook, our post-show follow-up framework, our account-based event marketing approach, our builders directory, and our RFQ tool.
References
- Center for Exhibition Industry Research (CEIR) research on exhibitor performance metrics, 2024.
- UFI Global Exhibition Barometer, 32nd edition. Attribution practice in European B2B. 2025.
- Bain & Company commentary on marketing and sales attribution disputes, 2024.
- McKinsey & Company commentary on multi-touch attribution for B2B events, 2024.
- Harvard Business Review commentary on CFO scrutiny of marketing attribution, 2024.
- Forrester Research commentary on B2B marketing attribution, 2024.
- Adobe Marketo Measure product documentation on B2B attribution modeling.
- Forrester (formerly SiriusDecisions) attribution modeling frameworks for B2B marketing.
FAQFrequently asked questions
Last-touch attribution credits the channel that delivered the final pre-conversion touch with 100 percent of the revenue. For B2B trade fair pipeline, the final touch is almost always a sales-team-direct action (call, email, demo) that closes the deal weeks or months after the fair. Under last-touch, the fair receives zero credit even though it generated the qualified pipeline that the sales team then closed.
The result is a systematic 60-80 percent under-attribution to trade fairs, which over time destroys the budget defence and starves the highest-ROI channel of investment. CEIR research has documented this pattern repeatedly across European exhibitor cohorts.
A position-based ‘U-shaped’ model with 40 percent weight to the first qualifying touch (typically the fair), 40 percent to the last pre-conversion touch (typically a sales action), and 20 percent distributed across middle touches is the most defensible for European B2B trade fair pipeline.
For complex multi-stakeholder deals, a ‘W-shaped’ model adds 40 percent weight at the opportunity-creation touch, distributing 30/30/30 across first-touch, opportunity-creation, and pre-conversion touches with 10 percent on middle touches. Both models give trade fairs credit proportional to their actual influence without overstating their role in deals that involved substantial multi-channel nurture.
The negotiation happens upfront, not after results are reported. Convene CFO, CRO, and CMO; document the attribution methodology in a written policy approved by all three; commit to applying the methodology consistently for at least four quarters before any adjustment; and review annually with a documented rationale for any changes.
The principle is that methodology disagreements should be resolved before they affect specific budget decisions, not litigated quarter by quarter. CFOs accept attribution numbers when the methodology has institutional sign-off; they reject numbers when the methodology appears to have been chosen to flatter the campaign.
HubSpot offers native multi-touch attribution reports (linear, U-shaped, W-shaped, time-decay) for any opportunity stage configured in the platform.
Salesforce requires either Marketing Cloud Account Engagement (Pardot) attribution, Salesforce Campaign Influence (with custom weighting via Trailhead-style configuration), or third-party tools like Bizible (now Adobe Marketo Measure), Dreamdata, or Demandbase Pipeline Attribution. For most European mid-market exhibitors, native platform attribution is sufficient.
Enterprise-scale exhibitors with complex multi-product pipeline typically run a specialised attribution tool alongside the CRM.
Three challenges are specific to trade fairs: (1) the fair touch often spans multiple days with multiple in-person interactions that flatten into a single CRM event, losing granularity; (2) the fair touch happens in a context where digital tracking is unavailable, so the link between fair-floor conversation and subsequent digital engagement must be reconstructed through self-reported attribution or capture-app integration; (3) the fair budget is concentrated (one or two quarters per year) but the pipeline impact distributes across the following 12-18 months, making same-quarter ROI reporting structurally misleading.
The methodology must account for all three or it will systematically misrepresent trade fair performance.
Twelve months from fair date is the defensible window for European B2B trade fair pipeline measurement. Shorter windows (90 days, 180 days) undercount because long-cycle enterprise deals have not yet closed; longer windows (24 months) add noise from market dynamics unrelated to the fair.
Twelve months captures the full opportunity-creation tail (typically 6-9 months post-fair) plus the deal-close tail (typically 3-6 months post-opportunity-creation) for the bulk of B2B sales motions. Report provisional 90-day and 180-day attribution alongside the 12-month figures for early-signal directional reading, but anchor the budget conversation on the 12-month numbers.