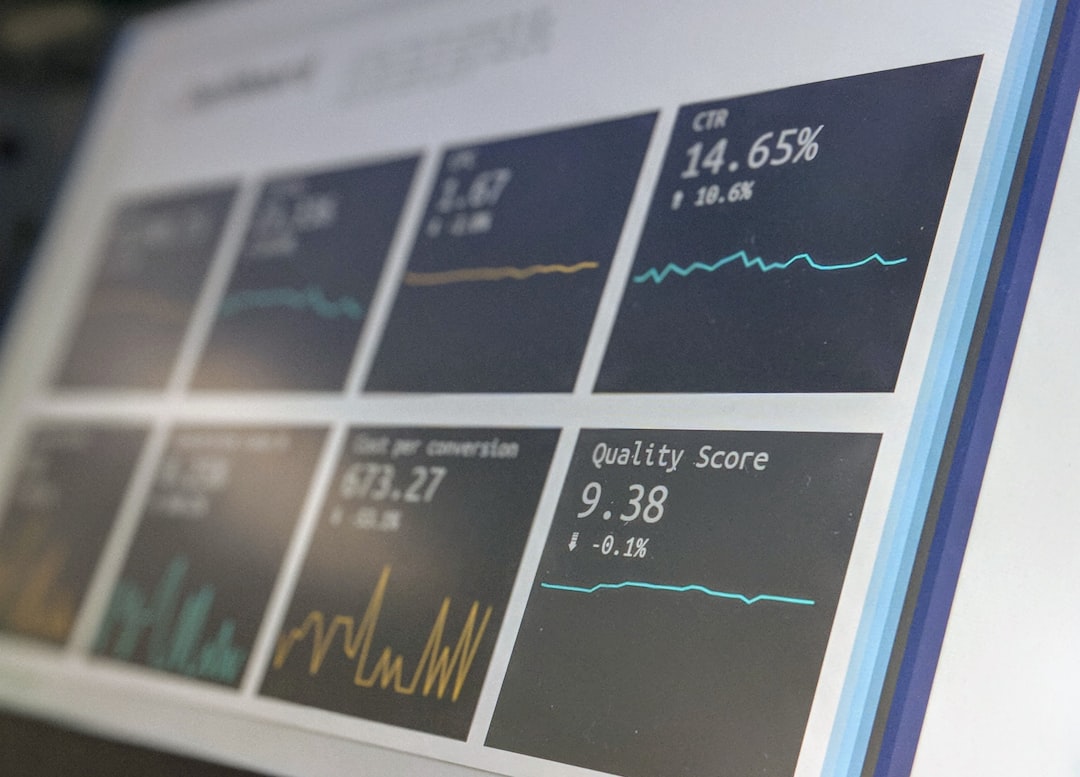
Most trade fair programmes are over-measured at the diagnostic level and under-measured at the executive-reporting level. The lead capture platform produces 30+ metrics. The marketing-automation platform produces another 40+. The CRM contributes 25+ opportunity and revenue metrics. The press-monitoring tool produces 15+ media metrics.
A typical mid-size European exhibitor running four fairs per year therefore has access to over 400 individual data points across the programme, and reports six numbers to the board.
The art of trade fair KPI design is choosing the right six. The wrong six produce a report that nobody can act on; the right six produce the budget conversation that defends the programme.
This article walks through the six-KPI framework that experienced European exhibition managers actually use. It draws on AUMA exhibitor cost benchmarks, UFI Global Barometer methodology, MPI EventScape executive reporting practices, and the dashboard structures documented at European member organisations of FAMAB.
Why six and not three, twelve, or twenty
Three KPIs is insufficient because trade fair programmes span four distinct dimensions, efficiency, conversion, return, and brand, and three metrics cannot adequately represent all four without dropping one. Twelve KPIs is too many for executive reporting; the eye loses focus past six to seven items, and the report becomes diagnostic rather than directional. Twenty KPIs is operationally useful but executively useless.
Six KPIs is the sweet spot that maps to the four programme dimensions plus the two cross-cutting axes (programme maturity and experience quality) that determine whether the programme will sustain or decay over time.
“Common framing among UFI-member exhibitor reporting leads is that the executive dashboard needs to answer four questions on one page: are we spending efficiently, are we converting well, are we returning capital, and are we building brand. Six KPIs answer all four. Anything more invites disagreement on what matters. Anything less leaves gaps that get filled with anecdotes.”, Common practice at AUMA-affiliated exhibitor reporting teams
The six core KPIs
KPI 1: Cost-per-qualified-contact (EUR)
Definition: Full-loaded programme cost divided by total qualified contacts (pre-booked meetings + walk-in qualified leads from A and B priority tiers; C-tier and unqualified scans excluded).
Target band: roughly EUR 130-280 based on aggregated exhibitor cost data, not a specific published AUMA figure. Below this range typically signals tier-two fair efficiency or exceptional programme execution. Above this range typically signals under-attended fair, under-staffed booth, or weak pre-show marketing.
Owner: Marketing operations.
Reporting cadence: Available within 24 hours of fair close; published in preliminary report at day 14.
Diagnostic sub-metrics: Cost-per-pre-booked-meeting, cost-per-walk-in-qualified, pre-show marketing cost as percentage of total, full-loaded cost as multiple of stand-and-build cost.
KPI 2: Opportunity-creation rate (%)
Definition: CRM opportunities created within 90 days of fair close, divided by total captured leads. Includes both opportunities created from the fair-sourced contact and opportunities accelerated for existing accounts where the fair was a qualifying touch.
Target band: 12-18 percent for well-managed European B2B programmes. Below 8 percent signals capture-quality issues, follow-up cadence failures, or fair-fit problems. Above 20 percent typically signals either an exceptional fair-fit or a tagging inflation issue (over-tagging at the booth).
Owner: Joint between marketing operations and sales operations.
Reporting cadence: 30-day preliminary figure, 90-day final figure.
Diagnostic sub-metrics: Opportunity-creation rate by lead tier (A, B, C), opportunity-creation rate by sales region, opportunity-creation rate by lead-source channel within the fair (pre-booked meeting versus walk-in versus organiser matchmaking).
KPI 3: Attributed-revenue ROI (multiple)
Definition: 12-month attributed revenue (from multi-touch attribution model, fair-weighted at the agreed percentage) divided by full-loaded programme cost.
Target band: 4-10x for mature programmes. Below 3x signals attribution or fundamental fit issues. Above 12x typically signals attribution model that is too generous to the fair touch.
Owner: Marketing leadership, with finance validation.
Reporting cadence: Preliminary 90-day figure (carries 30-50 percent of full revenue typically); 12-month final figure.
Diagnostic sub-metrics: Gross attributed revenue, attribution-adjusted revenue, gross profit ROI at standard margin, multi-year ROI projection.
KPI 4: Pre-booked meeting share (%)
Definition: Total pre-booked meetings divided by total stand interactions (pre-booked + walk-in qualified + walk-in unqualified contacts).
Target band: 40-60 percent for mature programmes. Below 30 percent signals weak pre-show marketing. Above 70 percent signals over-booking that crowds out walk-in opportunity and reduces the booth’s serendipity dividend.
Owner: Pre-show marketing team (typically marketing + SDR).
Reporting cadence: Available within 48 hours; reflects the programme maturity dimension.
Diagnostic sub-metrics: Pre-booked meetings by source channel (LinkedIn outbound, organiser matchmaking, CRM warm contacts, cold email), no-show rate on pre-booked meetings, conversion rate of pre-booked meetings to opportunities.
KPI 5: Visitor net promoter score (NPS)
Definition: Post-show survey to all captured leads asking the NPS question (“How likely are you to recommend [exhibitor] to a peer in your industry?”) with stand-experience context. Score = % Promoters - % Detractors.
Target band: 35+ for European B2B fairs; 45+ for premium-brand-positioning stands. Below 20 signals stand-experience problems (staffing, dwell-time management, conversation quality).
Owner: Customer experience lead or stand-team lead.
Reporting cadence: 7-14 days for response accumulation to statistical significance.
Diagnostic sub-metrics: NPS by stand zone, NPS by stand-staff person, NPS by lead tier, qualitative themes from open-text follow-up.
KPI 6: Share-of-voice (rank)
Definition: Percentage of fair-window trade-press and digital coverage in the relevant vertical that mentions the exhibitor’s brand, ranked against named competitor set (typically 5-10 direct competitors).
Target band: Above 50th percentile in comparator set for tier-one fairs; above 75th percentile for fairs where brand-presence is the primary objective.
Owner: Communications or PR team.
Reporting cadence: Real-time during fair window via media-monitoring tools (Meltwater, Brandwatch, Cision); trailing 30-day figure at day 35-40.
Diagnostic sub-metrics: Mentions by publication tier, mentions by region, sentiment breakdown, mentions tied to product launches versus general brand coverage.
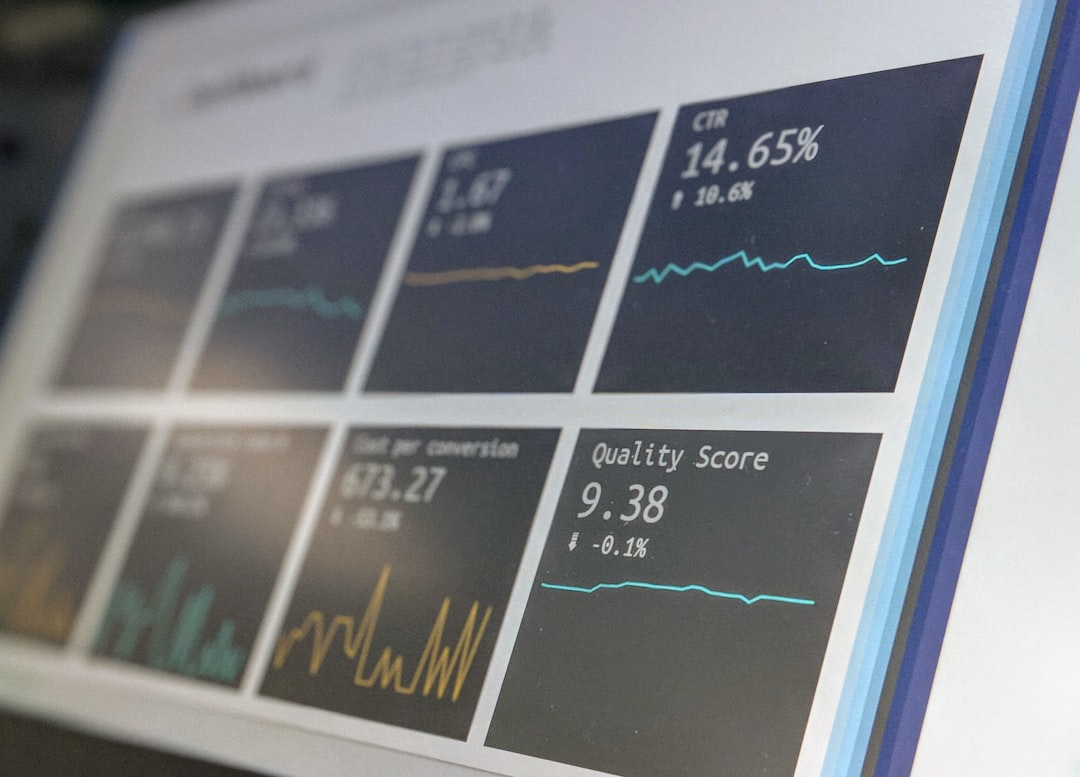
The six KPIs on a single dashboard
The table below shows the dashboard structure most experienced European exhibitors use. One row per fair, six columns for the core KPIs.
| Fair | Cost/contact (EUR) | Opp creation rate | 12-mo ROI | Pre-booked share | NPS | Share-of-voice rank |
|---|---|---|---|---|---|---|
| Hannover Messe (April) | 218 | 14.2% | 5.6x | 52% | 41 | 3 of 8 |
| EuroShop (March) | 245 | 11.8% | 4.2x | 48% | 38 | 4 of 6 |
| MWC Barcelona (Feb) | 192 | 16.5% | 7.1x | 58% | 44 | 2 of 9 |
| Anuga (October) | 165 | 13.9% | 6.8x | 45% | 39 | 5 of 12 |
| Year-to-date roll-up | 205 | 14.1% | 5.9x | 51% | 40.5 | avg 3.5 |
Trend arrows comparing each cell to the same fair in the prior year provide directional context without crowding the dashboard. The dashboard fits on one screen and answers the four executive questions (efficiency, conversion, return, brand) in a single glance.
The KPI weighting changes by stand objective
The six KPIs apply to every stand, but the weighting changes by stand objective. The table below summarises typical weighting patterns for the three dominant European exhibitor objective patterns.
| KPI | Lead-generation stand | Brand-presence stand | Product-launch stand |
|---|---|---|---|
| Cost-per-qualified-contact | High weight | Low weight | Medium weight |
| Opportunity-creation rate | High weight | Low weight | High weight |
| Attributed-revenue ROI | High weight | Low weight (lift-study layer added) | High weight |
| Pre-booked meeting share | High weight | Medium weight | High weight |
| Visitor NPS | Medium weight | High weight | High weight |
| Share-of-voice rank | Low weight | High weight | High weight |
The weighting needs to be set at the objective-setting stage (see the Objective Setting article) and applied consistently in reporting. Mixing weights across stands or changing weights between reporting cycles undermines the comparability that makes the KPI framework valuable.
Diagnostic metrics that explain movement in the core six
When a core KPI moves outside target band, the diagnostic metrics explain why. The table below maps each core KPI to its primary diagnostic sub-metrics.
| Core KPI | Movement direction | Diagnostic to check |
|---|---|---|
| Cost-per-contact up | Worse | Pre-show marketing efficiency, walk-in volume, staffing utilisation |
| Cost-per-contact down | Better | Pre-show ramp scaling, channel-mix optimisation |
| Opportunity-creation rate up | Better | Lead-qualification rigour, follow-up cadence speed |
| Opportunity-creation rate down | Worse | Capture quality, follow-up speed, sales-team handoff cleanness |
| ROI up | Better | Attribution-window expansion, deal-size growth, conversion-rate improvement |
| ROI down | Worse | Cost stack increase, attribution-model change, conversion-rate decline |
| Pre-booked share up | Better (within band) | Pre-show ramp effectiveness, organiser matchmaking adoption |
| Pre-booked share down | Worse | Pre-show ramp start date, channel-mix issues |
| NPS up | Better | Staffing model, dwell-time management, conversation quality |
| NPS down | Worse | Booth congestion, qualification fatigue, sales-pressure perception |
| Share-of-voice up | Better | Trade-press placements, product-launch coverage, social amplification |
| Share-of-voice down | Worse | Competitor activity, press-engagement weakness |
The discipline: when reporting a movement in any core KPI, include the diagnostic sub-metric that explains the movement. Reports that show a 3-point drop in NPS without diagnostic context get pushback from executives because there is no actionable signal. Reports that show the same drop with “stand-staff person C accounted for 70 percent of detractor responses; coaching plan in place for next fair” produce immediate executive trust.
How European exhibitors actually report against these KPIs
“The reporting cadence that wins executive buy-in is a 14-day preliminary report with the four immediately-measurable KPIs (cost-per-contact, pre-booked share, NPS, share-of-voice) and a 90-day final report with all six. The 14-day report shows the team has discipline; the 90-day report shows the programme has return. The temptation to wait 90 days for everything and then publish a single report typically loses the executive narrative because the gap between fair-close and report-publication is filled with anecdote.”, Common framing among AUMA-affiliated reporting teams
The cadence:
- Day 1-2 post-fair: internal debrief with stand-team feedback, qualitative themes, and preliminary numbers on cost-per-contact and pre-booked share.
- Day 14 post-fair: preliminary report to executive sponsors with four KPIs and qualitative themes.
- Day 30 post-fair: opportunity-creation rate (preliminary) added; share-of-voice trailing figure available.
- Day 90 post-fair: full report with all six KPIs; year-on-year comparison; budget recommendations for next fair cycle.
- Day 365 post-fair: 12-month attributed revenue final number; ROI multiple finalised; historical record for the next year’s budget conversation.
Common KPI framework mistakes
- Tracking activity metrics instead of outcome metrics. Badge-scan volume, social mentions, booth dwell-time are diagnostic; they are not the core KPI. Reporting them as KPIs invites “we had 600 scans” as a defence when the underlying opportunity-creation rate was 4 percent.
- No agreed targets per KPI. The KPI value without a target is data without judgement. Targets need to be set in advance and reviewed annually against industry benchmarks.
- Different KPI weightings across fairs. A brand-presence stand reported with lead-generation KPI weights looks like a failure; a lead-generation stand reported with brand KPI weights looks like a success. Inconsistent weighting produces inconsistent executive judgements.
- No owner for each KPI. Orphaned KPIs do not get diagnosed when they move. The marketing-operations team does not own NPS; the customer-experience team does not own ROI. Clear ownership is the precondition for accountability.
- Over-reporting diagnostic detail. A 24-page slide deck loses executive attention by slide 6. The six-KPI dashboard with diagnostic detail in an appendix is the format that survives executive review.
- No year-on-year comparison. A single-year figure is uninterpretable without context. The KPI framework gains power when applied consistently across multiple years and multiple fairs.
Building the KPI framework into the planning cycle
The KPI framework needs to be embedded in the planning cycle, not bolted on at reporting time. The planning steps:
- Pre-fair (week 16 before fair): confirm KPI targets per fair, agree weightings against stand objective, validate measurement infrastructure (CRM tagging, attribution model, survey instrument, media-monitoring set-up).
- Pre-fair (week 4 before fair): dashboard skeleton created in BI tool with prior-year and target columns populated.
- During fair: real-time dashboard for cost-per-contact, scan-volume, qualification distribution, and share-of-voice mentions.
- Post-fair (day 14): preliminary report.
- Post-fair (day 90): final report.
- Annual review: roll-up of all fairs against KPI targets, recommendation for the next year’s fair calendar, target adjustments.
How to act on this
A workable KPI framework has to be built into the stand itself, because capture devices, observation zones and survey prompts all need physical space and a cost model behind them. Set the measurement infrastructure up alongside the build using the following:
- Brief stand builders via /rfq on the KPI framework so the booth design supports the measurement infrastructure (lead capture device positioning, dwell-time observation zones, survey-prompt placement).
- Use the Builders Directory to find partners experienced with integrated KPI reporting (not all builders work at this level).
- Use the Fairs Directory to identify which fairs match the KPI mix appropriate for each stand objective.
- Run the Booth Cost Calculator to model the full-loaded programme cost that drives cost-per-contact and ROI calculations.
Related reading
- ROI Measurement, the attribution methodology underpinning the ROI KPI
- Budget Defense to CFO and CEO, the conversation the KPI dashboard supports
- Objective Setting for Trade Fairs, assigning the right KPI weights at planning time
- Lead Qualification and Scoring, the qualification rigour that underpins opportunity-creation rate
- Pre-Show Marketing Ramp, the ramp that drives pre-booked meeting share
References and primary sources
- AUMA-Trends and AUMA Exhibitor Outlook survey publications, Association of the German Trade Fair Industry, auma.de
- UFI Global Barometer 2026 wave, Union des Foires Internationales, ufi.org
- MPI EventScape 2026 industry outlook, Meeting Professionals International, mpi.org
- FAMAB Verband Direkte Wirtschaftskommunikation reporting framework, famab.de
- Cvent State of the Event Industry 2026 report
- Swapcard Exhibitor Benchmark Report 2025-2026
- Salesforce State of Sales 2026 benchmarks for B2B opportunity conversion
- HubSpot Sales Operations Benchmark Report 2026 on multi-touch attribution
FAQFrequently asked questions
Cost-per-qualified-contact (EUR per qualified lead, benchmarked against AUMA’s EUR 130-280 range), opportunity-creation rate (90-day conversion of captured leads to CRM opportunities, target 12-18 percent), attributed-revenue ROI (12-month attributed revenue divided by full-loaded programme cost, target 4-10x), pre-booked meeting share (percentage of stand interactions that were scheduled before the fair, target 40-60 percent), visitor net promoter score (NPS measured via post-show survey at the stand-interaction level, target 35+), and share-of-voice (trade-press and digital coverage during the fair window relative to direct competitors, target above 50th percentile in the comparator set).
These six map directly to the budget conversation. Cost-per-contact answers efficiency; opportunity-creation rate answers conversion quality; ROI answers commercial return; pre-booked meeting share answers programme maturity; NPS answers experience quality; share-of-voice answers brand impact.
The remaining metrics most platforms produce (booth dwell time, badge-scan volume, hospitality spend, social mentions) are diagnostic metrics that explain movements in the six core KPIs but are not themselves the reporting line. Reporting too many metrics dilutes the executive narrative and invites debate on which metrics matter rather than on the programme’s performance.
A single dashboard with one row per fair and six columns for the core KPIs, plus a year-to-date roll-up row. Cost-per-contact and ROI are EUR-denominated; opportunity-creation rate, pre-booked meeting share, and NPS are percentages; share-of-voice is a rank within the named competitor set. Trend arrows compare to the same fair from the prior year.
A second view breaks each fair’s KPIs by sales region or product line for the programmes that need that lens. Most experienced European exhibitors run the dashboard in their CRM or in a dedicated BI tool (Tableau, Looker, Power BI) with monthly refresh frequency between fairs and weekly refresh during the post-show 90-day attribution window.
Brand-presence stands de-emphasise cost-per-contact and opportunity-creation rate (lower volumes are intentional) and emphasise share-of-voice, NPS, and account-engagement uplift. Lead-generation stands emphasise the inverse. The KPI weights need to align with the stand’s primary objective set out in the SMART objectives at fair-planning time.
Reporting a brand-presence stand against the same KPI weights as a lead-generation stand produces a misleading performance picture and frequently leads to incorrect budget decisions about which fairs to expand or cut. The objective-setting article on this site walks through how to assign the right KPI weighting at planning time.
Cost-per-contact is owned by the marketing operations team (responsible for capture infrastructure and pre-show marketing efficiency). Opportunity-creation rate is jointly owned by marketing and sales operations (capture and qualification quality drives this). Attributed-revenue ROI is owned by marketing leadership with finance validation.
Pre-booked meeting share is owned by the marketing-and-SDR team responsible for the pre-show ramp. NPS is owned by the customer-experience or stand-team lead. Share-of-voice is owned by communications or PR. Clear ownership prevents the KPI from becoming an orphan in cross-functional reporting and ensures someone is accountable for diagnostic and corrective action when a KPI moves outside target band.
Cost-per-contact: within 24 hours (raw figure available once all scans sync). Opportunity-creation rate: 30 days minimum, 90 days for the full attribution window. Attributed-revenue ROI: 12 months for the full window; preliminary 90-day and 6-month figures available earlier with disclaimers. Pre-booked meeting share: within 48 hours (calendar data syncs immediately).
NPS: 7-14 days for survey responses to accumulate to statistical significance. Share-of-voice: real-time during the fair window via media-monitoring tools, with the trailing 30-day figure available at day 35-40. Most exhibitors publish a preliminary report within 14 days of fair close (covering the first four metrics) and a final report at 90 days post-fair.