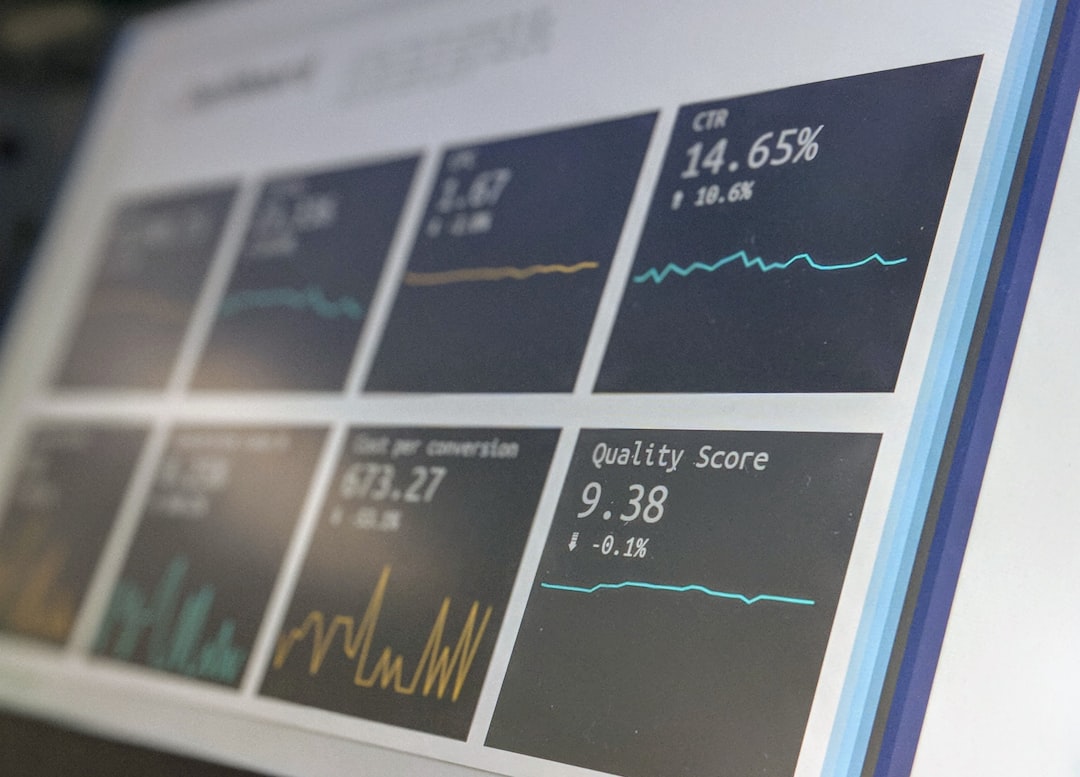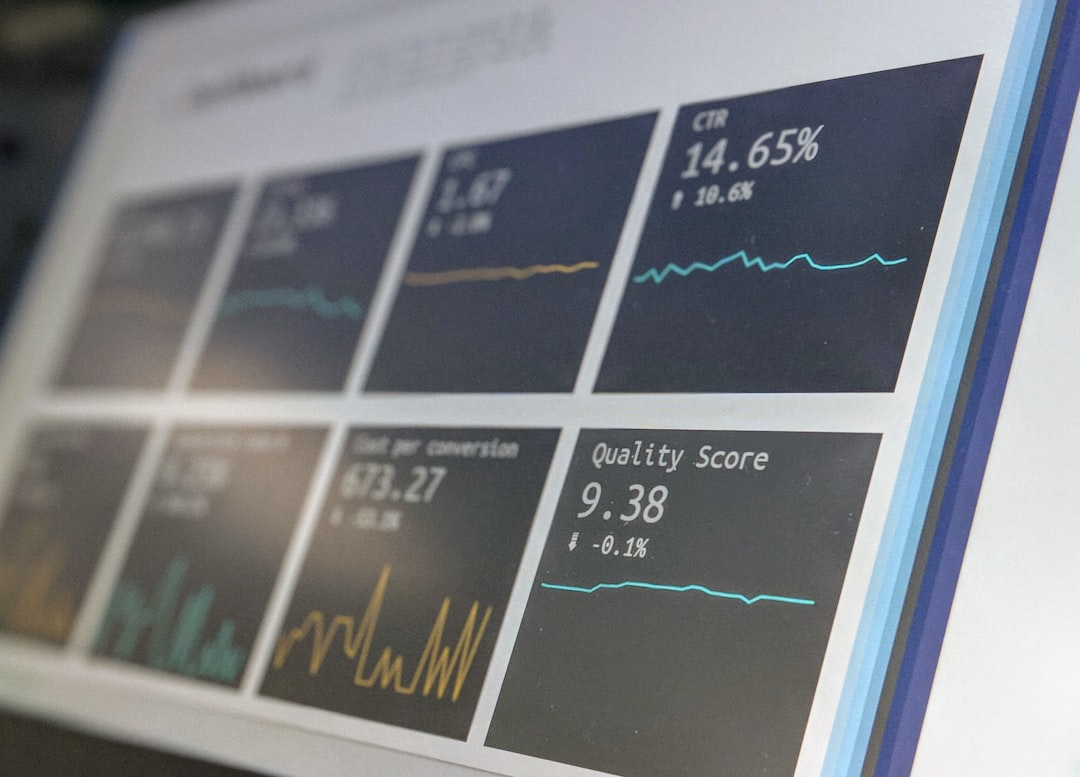
The executive dashboard answers strategic questions on quarterly cadence. The operational dashboard answers tactical questions on daily and weekly cadence. The two are different views of the same underlying performance, calibrated to different decision-making rhythms and different audiences.
A marketing-director-level operational dashboard with twenty metrics enables same-day adjustments during fair-week; the same dashboard at executive level produces fatigue and obscures the strategic conversation. This article documents the twenty operational KPIs that European tier-one exhibitor teams monitor through fair-week and the follow-up period.
The frame: operational metrics are leading indicators. They predict the executive metrics that will be reported quarterly. The discipline of operational reporting is catching problems while they are still recoverable.
The twenty operational KPIs
The metrics organise around four categories: capture velocity, capture quality, follow-up execution, and integration health.
Capture velocity (5 metrics)
KPI 1, 24-hour rolling capture volume. Total leads captured in the prior 24 hours, refreshed hourly. Leading indicator of fair-day performance. Target: aligned with pre-fair forecast within ±10 percent.
KPI 2, Captured leads per active staff-hour. Volume divided by active staff hours on the floor. Indicates staff productivity. Target: 25-40 captured leads per active staff-hour at well-executed European tier-one fairs.
KPI 3, Pre-booked meeting completion rate. Percentage of pre-booked meetings that actually occurred at the fair (vs no-show or rescheduled). Target: 78-92 percent.
KPI 4, Walk-in capture rate. Estimated walk-in capture as a percentage of estimated stand footfall. Target: 12-22 percent for tier-one B2B fairs.
KPI 5, Capture velocity by hour of day. Captured leads bucketed into hourly time blocks across the fair day. Reveals the peak-and-trough pattern and supports same-day staffing adjustments.
Capture quality (5 metrics)
KPI 6, Daily score distribution. Histogram of captured lead scores. Target: 12-18 percent above 75, 28-38 percent in 55-74 band, 35-45 percent in 30-54 band, balance below 30.
KPI 7, Field completeness rate. Percentage of captured leads with all mandatory qualifier fields populated. Target: 88-96 percent.
KPI 8, Champion identification rate. For deals using MEDDIC qualification: percentage of captured leads with Champion field populated. Target: 25-40 percent for direct-decision-maker conversations; lower for evaluator-heavy fairs.
KPI 9, Average conversation length. Mean conversation duration for captured leads. Target: 8-14 minutes for greeter-captured, 18-32 minutes for demo-specialist-captured.
KPI 10, Duplicate capture rate. Percentage of captured leads that match existing CRM contacts. Target: 18-32 percent (lower than this suggests poor list hygiene; higher suggests the team is recapturing existing relationships).
Follow-up execution (5 metrics)
KPI 11, Touch 1 SLA adherence. Percentage of captured leads receiving Touch 1 automated email within 4 hours. Target: 96-100 percent.
KPI 12, Touch 2 SLA adherence (75+ scores). Percentage of high-score leads receiving Touch 2 rep contact within 24-48 hours. Target: 90-100 percent.
KPI 13, Touch 1 open rate. Percentage of Touch 1 emails opened. Target: 48-62 percent for personalised post-show emails.
KPI 14, Touch 2 connect rate. Percentage of Touch 2 phone or LinkedIn attempts that achieved a real conversation. Target: 32-48 percent.
KPI 15, 30-day meeting-booking rate. Percentage of captured leads converted to a booked follow-up meeting within 30 days. Target: 14-22 percent for 55+ score leads.
Integration health (5 metrics)
KPI 16, Capture-app to CRM sync latency. Average minutes from lead capture to CRM record creation. Target: under 5 minutes for real-time integrations.
KPI 17, Data-quality flag rate. Percentage of captured leads flagged with data-quality issues (missing email, invalid phone, suspected duplicate). Target: under 6 percent.
KPI 18, Score calculation accuracy. Percentage of captured leads with complete score calculation (no null inputs). Target: 92-98 percent.
KPI 19, Routing automation success rate. Percentage of leads routed to the correct sequence and assigned rep. Target: 95-100 percent.
KPI 20, Dashboard freshness. Time since last data refresh in the operational dashboard. Target: under 60 minutes during fair-week.
Daily fair-week reporting structure
The operational dashboard refreshes hourly during fair-week. The team runs a structured 15-minute morning review at 08:00 fair-time covering:
- Prior-day capture volume and trend (KPI 1, 5)
- Score distribution and quality flags (KPI 6, 7, 17)
- SLA adherence on touches sent in the prior 24 hours (KPI 11, 12)
- Open rate and connect rate trends (KPI 13, 14)
- Integration health issues (KPI 16, 18, 19)
- Adjustments for the day ahead
The 15-minute structure produces actionable adjustments daily. The discipline of running it every morning is what catches problems while they are still recoverable.
“Trade fair operations live or die on the morning huddle. Teams that skip it accumulate problems that surface only in the post-fair retro. Teams that run it religiously catch staffing, messaging and integration issues within hours and fix them by end of day.”, UFI Global Exhibition Barometer, operational practice commentary, 2025
Weekly post-fair reporting structure
Weeks 1-4 post-fair, the dashboard refreshes daily but is reviewed weekly. The Monday-morning review covers:
- Lead-to-meeting conversion rate by score band (KPI 15)
- Touch 4 and Touch 5 (breakup) performance
- Opportunity creation by fair-source tag
- Stage-progression velocity of fair-sourced opportunities
- Early signals of unusual win-rate or deal-size patterns
Weeks 5-12, weekly cadence continues with a focus on opportunity stage progression and conversion bands. Months 4-12, monthly cadence focuses on deal close and revenue attribution.
Early-warning signals: distinguishing recoverable from catastrophic
Operational KPIs serve their primary purpose by identifying problems early. The pattern recognition that matters:
Recoverable problem patterns:
- Day-one capture velocity 10-15 percent below forecast. Likely cause: staffing mismatches, slow start. Recovery: shift staff allocation, adjust messaging. Recoverable by day three.
- Touch 1 open rate at 32 percent. Likely cause: subject-line or sender configuration issue. Recovery: rotate subject lines, switch sender. Recoverable within 24 hours.
- Score distribution heavy on low end (under 30 percent above 55). Likely cause: pre-show targeting attracted wrong audience or stand messaging unclear. Recovery: re-brief staff on qualifying questions, adjust messaging. Recoverable by day two-three.
Catastrophic problem patterns:
- Day-one capture velocity 40+ percent below forecast. Likely cause: structural traffic problem at the fair, stand location issue, or fundamental pre-show campaign failure. Recovery: limited; salvage operation focused on quality over volume.
- Touch 1 SLA adherence under 60 percent on day one. Likely cause: integration failure between capture app and CRM. Recovery: emergency manual workaround; structural problem must be fixed before next fair.
- Capture-app to CRM sync latency over 4 hours. Likely cause: integration broken. Recovery: emergency manual processing; the 72-hour follow-up rule cannot be met until fixed.
- Champion identification rate at 5 percent against 25-40 percent target. Likely cause: qualifying conversations not happening or staff not trained on MEDDIC. Recovery: re-train urgently; the underlying conversion will collapse without it.
The key discriminator between recoverable and catastrophic is whether the operational fix can be deployed within the fair-week window. Catastrophic problems generally require infrastructure or training investments that take longer than the fair to resolve; recoverable problems can be addressed with messaging, staffing, or process adjustments same-day.
“The single highest-leverage skill for a trade fair operational lead is pattern recognition on the early warning signals. Identifying that day-one capture velocity is structurally off rather than just slow-starting is the difference between a salvage operation and a recovery operation.”, Bain & Company, operations commentary, 2024
Specific operational dashboard tooling
The operational dashboard runs on the same CRM and BI infrastructure as the executive dashboard, with different refresh cadence and different metric organisation.
| Component | Recommended tooling |
|---|---|
| CRM source | HubSpot, Salesforce, Pardot |
| Sales engagement timestamps | Outreach, SalesLoft, native CRM cadences |
| Real-time data sync | Native connectors or Hightouch / Census |
| Operational dashboard layer | Looker, Power BI, native CRM dashboards |
| Alerting | Slack alerts via Zapier or native integrations |
| Mobile access | Dashboard responsive view; key alerts via mobile push |
The mobile access is operationally important. The stand manager at Hannover Messe walking the floor needs the dashboard accessible from a phone, not anchored to a laptop in the back office. Mobile-responsive dashboards plus mobile push alerts on critical KPIs are the operational standard.
Worked example: fair-week operational dashboard for Anuga
Sample dashboard output from day two of a five-day Anuga fair for a 150 sqm food-and-beverage equipment exhibitor:
Capture velocity panel
| Metric | Day 1 | Day 2 (mid-day) | Forecast | Status |
|---|---|---|---|---|
| Captured leads | 168 | 102 (target 96 by 13:00) | 180/day | On track |
| Captured per active staff-hour | 24 | 28 | 25-40 | On track |
| Pre-booked meeting completion | 88% | 91% | 80%+ | Above target |
| Walk-in capture rate (est) | 16% | 18% | 12-22% | On track |
Capture quality panel
| Metric | Day 1 | Day 2 (mid-day) | Target | Status |
|---|---|---|---|---|
| Avg score | 58 | 62 | 50+ | Above target |
| % above 75 | 14% | 16% | 12-18% | On track |
| Field completeness | 92% | 89% | 88%+ | On track |
| Champion identification | 28% | 31% | 25-40% | On track |
| Duplicate rate | 22% | 24% | 18-32% | On track |
Follow-up execution panel
| Metric | Day 1 (now T+24h) | Target | Status |
|---|---|---|---|
| Touch 1 SLA adherence | 98% | 96%+ | On target |
| Touch 2 SLA adherence (75+) | 92% | 90%+ | On target |
| Touch 1 open rate | 54% | 48-62% | On target |
| Touch 2 connect rate | 38% | 32-48% | On target |
Integration health panel
| Metric | Status | Target |
|---|---|---|
| Capture app to CRM sync latency | 2.3 min avg | min |
| Data quality flag rate | 4.2% | % |
| Score calculation accuracy | 96% | 92-98% |
| Routing automation success | 99.1% | 95-100% |
| Dashboard freshness | 22 min ago | <60 min |
This dashboard would be reviewed in the daily 08:00 huddle. Day-one performance is at-or-above target across all four panels; day-two mid-day signals are consistent with continued on-target performance. No adjustments required; team continues as planned.
A different scenario: if day-one capture quality showed avg score 41 against target 50+, only 6 percent above 75 against target 12-18 percent, the huddle would diagnose root cause (likely either pre-show targeting drift or stand-floor messaging unclear), adjust accordingly, and re-measure at day-two mid-day to confirm recovery.
Connecting operational KPIs to executive metrics
The twenty operational KPIs feed the twelve executive metrics through aggregation:
| Executive metric | Operational KPIs that feed it |
|---|---|
| Cost per qualified lead | Capture velocity, capture quality, score distribution |
| Pipeline ratio | Score distribution, lead-to-opportunity conversion |
| Captured lead volume | 24-hour capture velocity, per staff-hour productivity |
| Pre-booked meeting ratio | Pre-booked meeting completion rate, conversion velocity |
| Lead-to-opportunity rate | Touch SLA adherence, follow-up open/connect rates |
| 72-hour SLA adherence | Touch 1 and Touch 2 SLA adherence operational metrics |
| Self-reported attribution | Field completeness, duplicate rate |
The operational metrics are the inputs; the executive metrics are the outputs. Improving the operational metrics improves the executive metrics with a 30-90 day lag depending on the conversion stage.
Common operational reporting failures
- Static dashboards. Daily-cadence reporting requires hourly refresh; without it, the morning huddle uses stale data.
- No mobile access. Stand managers cannot act on dashboards anchored to a laptop in the back office.
- No alert thresholds. SLA failures discovered hours late instead of in real time.
- Operational metrics surfaced to executives. Twenty-metric dashboards overwhelm the strategic conversation.
- No morning huddle discipline. Operational reporting without action conversion is documentation, not management.
- Integration-health metrics ignored. Sync latency and data-quality flags fail silently; problems compound.
Integration with the broader strategy
The operational KPIs are the leading indicators for the executive dashboard. They depend on data flows from the lead capture systems playbook, the lead qualification and scoring framework, and the post-show follow-up execution.
They feed the ROI measurement methodology and the budget defense framework.
For deeper coverage of adjacent topics, see our exhibition strategy hub, our pre-show marketing playbook, our objective setting framework, our account-based event marketing approach, our builders directory, and our RFQ tool.
References
- Center for Exhibition Industry Research (CEIR). Operational Performance Benchmarks. 2024.
- UFI Global Exhibition Barometer, 2025 wave. Operations and KPI practice.
- AUMA exhibitor guidance on operations standards, 2024-2025.
- Bain & Company. “Operational Discipline at Trade Fair Pace.” Bain Insights, May 2024.
- McKinsey & Company Events Practice. “Operational KPIs for Event Marketing.” 2024.
- Harvard Business Review. “Why the Morning Huddle Matters.” HBR Operations, August 2023.
- Forrester Research. B2B Marketing Operations Benchmarks. 2024.
- SiriusDecisions. Marketing Operations Framework. 2024 edition.
FAQFrequently asked questions
Executive dashboards trigger strategic decisions on quarterly cadence; operational KPIs trigger tactical adjustments on daily and weekly cadence. Mixing the two produces either operational fatigue at the executive level (twenty metrics is too many for a board conversation) or strategic blindness at the operational level (four metrics is too few to manage execution).
The disciplined practice separates the two views: the operational team works against twenty metrics that change daily during fair-week; the executive team works against twelve metrics that change quarterly. The operational metrics roll up into the executive metrics, but the operational view is where the work actually happens.
The 24-hour rolling capture velocity (qualified leads captured in the prior 24 hours) is the single strongest predictor of overall fair outcome. If day-one capture velocity tracks 15 percent or more below the same-day forecast, the fair is structurally underperforming and needs immediate intervention, usually in staffing or messaging, occasionally in pre-show traffic generation.
If day-one capture velocity tracks above forecast, the fair is on track and the operational focus shifts to capture quality and follow-up readiness. The 24-hour metric is leading; the 90-day pipeline metric is lagging.
Sales engagement platforms (Outreach, SalesLoft, HubSpot Sequences) timestamp every email send and call attempt, which makes SLA adherence trackable in real time through native reports. The dashboard should show for each lead captured: time-to-Touch-1, time-to-Touch-2 (for 75+ score leads), and current status against the SLA.
Late touches should generate Slack or Teams alerts to the marketing-operations team who can investigate and either fix the automation or escalate to the assigned rep. The visibility is the discipline; without it, SLA failures accumulate invisibly until aggregate reporting catches them days later.
Greeter and qualifier roles benchmark at 8-14 captured leads per staff-hour at peak fair flow. Demo specialists benchmark at 2-4 deeper-qualified leads per staff-hour. Meeting hosts complete 1-2 booked meetings per staff-hour. Hospitality and engagement zones capture 1-3 lower-intent leads per staff-hour.
Aggregate across all roles, a well-staffed 100 sqm stand captures roughly 25-40 leads per active staff-hour averaged across the fair day. Tracking this hourly during fair-week reveals which time blocks and which roles are underperforming, supporting same-day staffing adjustments.
The composite-scoring distribution per day is the real-time quality signal. If day-one captured leads score on average 56, with 8 percent above 75; and day-two captured leads score on average 42, with 3 percent above 75, the quality has degraded substantially even if capture volume is steady.
Root-cause investigation typically reveals staffing changes (fatigue, role mismatches), messaging issues (the wrong pitch attracting wrong-fit visitors), or pre-show traffic issues (low-quality audience converted by mid-fair). Tracking the daily score distribution alongside capture volume catches quality issues within hours of their emergence.
The operational dashboard runs at full intensity for the four weeks post-fair covering the active follow-up sequence, then shifts to weekly reporting for weeks 5-12, then monthly for months 4-12. The intensity matches the conversion velocity of the lead-cohort.
Active SLA adherence and follow-up sequence performance need daily attention in the first month; opportunity stage progression and conversion bands need weekly attention in months 2-3; full deal close and revenue attribution need monthly attention in months 4-12. The dashboard infrastructure stays in place; the review cadence steps down over time.